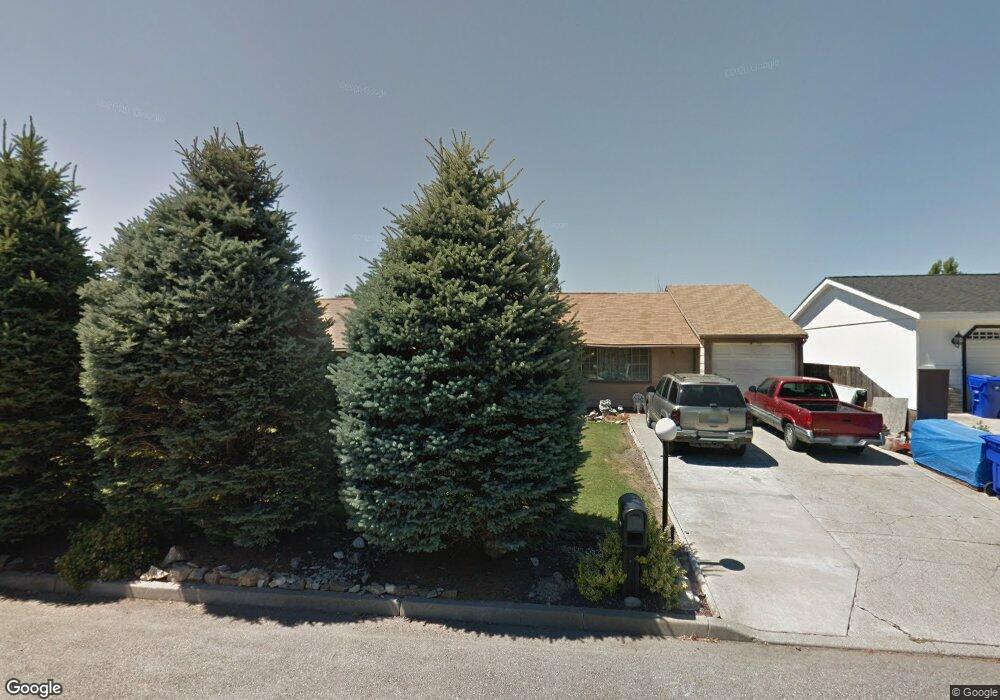
4913 N Mitchell Dr Otis Orchards, WA 99027
Otis Orchards-East Farms NeighborhoodEstimated Value: $365,000 - $434,000
3
Beds
2
Baths
1,612
Sq Ft
$247/Sq Ft
Est. Value
About This Home
This home is located at 4913 N Mitchell Dr, Otis Orchards, WA 99027 and is currently estimated at $398,457, approximately $247 per square foot. 4913 N Mitchell Dr is a home located in Spokane County with nearby schools including Otis Orchards School, East Valley Middle School, and East Valley High School & Extension.
Ownership History
Date
Name
Owned For
Owner Type
Purchase Details
Closed on
Aug 11, 2005
Sold by
Bond Thelma L and Clark Thelma L
Bought by
Seavey Marvin and Seavey Sandra
Current Estimated Value
Home Financials for this Owner
Home Financials are based on the most recent Mortgage that was taken out on this home.
Original Mortgage
$60,000
Outstanding Balance
$31,153
Interest Rate
5.48%
Mortgage Type
Purchase Money Mortgage
Estimated Equity
$367,304
Purchase Details
Closed on
Sep 17, 2004
Sold by
Bond Allen R
Bought by
Bond Thelma L
Home Financials for this Owner
Home Financials are based on the most recent Mortgage that was taken out on this home.
Original Mortgage
$105,600
Interest Rate
5.8%
Mortgage Type
New Conventional
Purchase Details
Closed on
Mar 30, 2001
Sold by
Clark Joseph W
Bought by
Clark Thelma L
Home Financials for this Owner
Home Financials are based on the most recent Mortgage that was taken out on this home.
Original Mortgage
$106,700
Interest Rate
7.19%
Create a Home Valuation Report for This Property
The Home Valuation Report is an in-depth analysis detailing your home's value as well as a comparison with similar homes in the area
Home Values in the Area
Average Home Value in this Area
Purchase History
| Date | Buyer | Sale Price | Title Company |
|---|---|---|---|
| Seavey Marvin | $140,000 | Transnation Title | |
| Bond Thelma L | -- | Transnation Title | |
| Bond Thelma L | -- | Pacific Nw Title | |
| Clark Thelma L | -- | Pacific Nw Title | |
| Clark Thelma L | $110,000 | Pacific Nw Title |
Source: Public Records
Mortgage History
| Date | Status | Borrower | Loan Amount |
|---|---|---|---|
| Open | Seavey Marvin | $60,000 | |
| Previous Owner | Bond Thelma L | $105,600 | |
| Previous Owner | Clark Thelma L | $106,700 |
Source: Public Records
Tax History Compared to Growth
Tax History
| Year | Tax Paid | Tax Assessment Tax Assessment Total Assessment is a certain percentage of the fair market value that is determined by local assessors to be the total taxable value of land and additions on the property. | Land | Improvement |
|---|---|---|---|---|
| 2025 | $748 | $356,100 | $90,000 | $266,100 |
| 2024 | $748 | $357,400 | $80,000 | $277,400 |
| 2023 | $743 | $364,600 | $80,000 | $284,600 |
| 2022 | $787 | $364,600 | $80,000 | $284,600 |
| 2021 | $831 | $222,600 | $55,000 | $167,600 |
| 2020 | $866 | $202,000 | $50,000 | $152,000 |
| 2019 | $869 | $180,300 | $40,000 | $140,300 |
| 2018 | $890 | $165,000 | $35,000 | $130,000 |
| 2017 | $915 | $148,600 | $35,000 | $113,600 |
| 2016 | $906 | $143,000 | $30,000 | $113,000 |
| 2015 | $1,239 | $134,300 | $25,000 | $109,300 |
| 2014 | -- | $134,300 | $25,000 | $109,300 |
| 2013 | -- | $0 | $0 | $0 |
Source: Public Records
Map
Nearby Homes
- 4806 N Drury Rd
- 23007 E Sanson Ln
- 5605 N Drury Rd
- 22707 E Rowan Ave
- 24005 E Garland Ave
- 6205 N Ormond Rd
- 99999 E Dalke Ave
- 21725 E Wellesley Ave Unit 9
- 21725 E Wellesley Ave Unit 24
- 21725 E Wellesley #38 Ave Unit 38
- 24225 E Rosewood Ave
- 6930 N Lynden Rd
- 5718 N Martinson Rd
- 23010 E Edgewater Ln
- 23015 E Edgewater Ln
- 23013 E Edgewater Ln
- 2625 N Rydal Ln
- 24672 Hawkstone Loop
- 5816 N Canal Rd
- 22512 Penrose Ln
- 4907 N Mitchell Dr
- 4919 N Mitchell Dr
- 4903 N Mitchell Dr
- 5005 N Mitchell Dr
- 4914 N Mitchell Dr
- 4908 N Mitchell Dr
- 4920 N Mitchell Dr
- 5011 N Mitchell Dr
- 4817 N Mitchell Dr
- 4904 N Mitchell Dr
- 5017 N Mitchell Dr
- 4916 N Drury Rd
- 5012 N Mitchell Dr
- 5510 N Drury Rd
- 4818 N Mitchell Dr
- 4811 N Mitchell Dr
- 4826 N Drury Rd
- 23409 E Wabash Ave
- 4812 N Mitchell Dr
- 4816 N Drury Rd