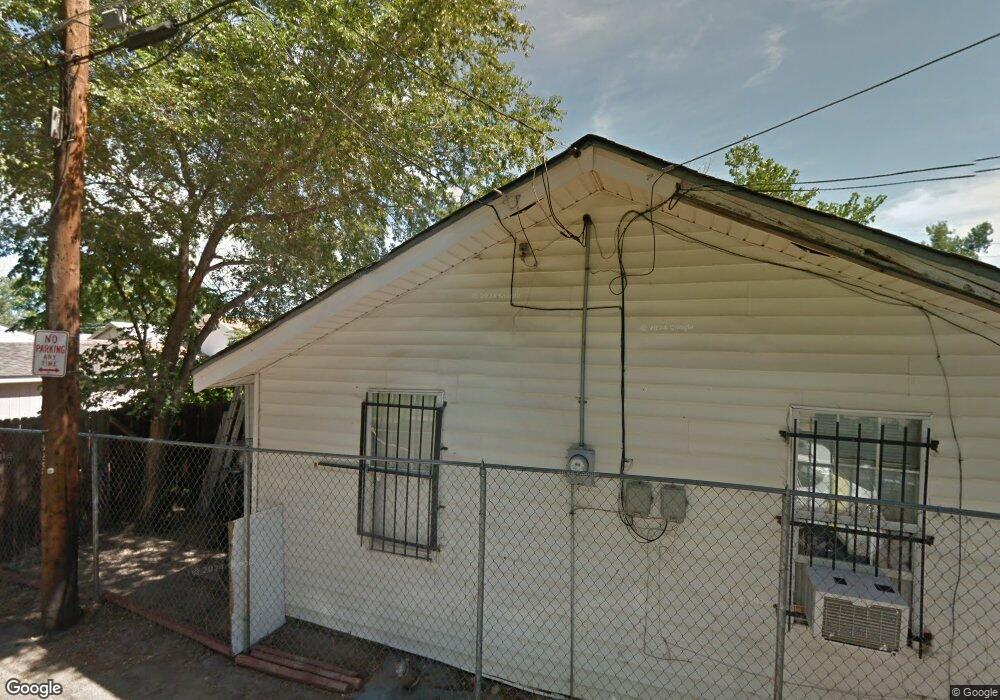
4915 Clayton St Denver, CO 80216
Elyria-Swansea NeighborhoodEstimated Value: $294,451 - $355,000
1
Bed
1
Bath
586
Sq Ft
$559/Sq Ft
Est. Value
About This Home
This home is located at 4915 Clayton St, Denver, CO 80216 and is currently estimated at $327,363, approximately $558 per square foot. 4915 Clayton St is a home located in Denver County with nearby schools including Swansea Elementary School, Whittier ECE-8 School, and Bruce Randolph School.
Ownership History
Date
Name
Owned For
Owner Type
Purchase Details
Closed on
Oct 8, 2021
Sold by
Clayton Real Estate Holdings Llc
Bought by
Corporate Properties Inc
Current Estimated Value
Purchase Details
Closed on
Feb 24, 2011
Sold by
Adix Thomas C
Bought by
Clayton Real Estate Holdings Llc
Purchase Details
Closed on
Jul 3, 2008
Sold by
Hsbc Bank Usa Na
Bought by
Adix Thomas C
Purchase Details
Closed on
May 16, 2008
Sold by
Guerra Marco A
Bought by
Hsbc Bank Usa Na and Ace Securities Corp Home Equity Loan Tru
Purchase Details
Closed on
Sep 14, 2004
Sold by
Guerra Marco Antionio
Bought by
Guerra Marco A
Home Financials for this Owner
Home Financials are based on the most recent Mortgage that was taken out on this home.
Original Mortgage
$105,600
Interest Rate
8.3%
Mortgage Type
New Conventional
Purchase Details
Closed on
May 14, 2003
Sold by
Guerra Pamela I
Bought by
Guerra Marco Antionio
Purchase Details
Closed on
Mar 30, 1998
Sold by
Henry Pamela I
Bought by
Guerra Pamela I
Create a Home Valuation Report for This Property
The Home Valuation Report is an in-depth analysis detailing your home's value as well as a comparison with similar homes in the area
Home Values in the Area
Average Home Value in this Area
Purchase History
| Date | Buyer | Sale Price | Title Company |
|---|---|---|---|
| Corporate Properties Inc | $220,000 | Wfg National Title | |
| Clayton Real Estate Holdings Llc | -- | None Available | |
| Adix Thomas C | $37,000 | None Available | |
| Hsbc Bank Usa Na | -- | None Available | |
| Guerra Marco A | -- | -- | |
| Guerra Marco Antionio | -- | Land Title Guarantee Company | |
| Guerra Pamela I | -- | -- |
Source: Public Records
Mortgage History
| Date | Status | Borrower | Loan Amount |
|---|---|---|---|
| Previous Owner | Guerra Marco A | $105,600 |
Source: Public Records
Tax History Compared to Growth
Tax History
| Year | Tax Paid | Tax Assessment Tax Assessment Total Assessment is a certain percentage of the fair market value that is determined by local assessors to be the total taxable value of land and additions on the property. | Land | Improvement |
|---|---|---|---|---|
| 2024 | $1,373 | $17,340 | $2,220 | $15,120 |
| 2023 | $1,344 | $17,340 | $2,220 | $15,120 |
| 2022 | $1,158 | $14,560 | $6,120 | $8,440 |
| 2021 | $1,118 | $14,980 | $6,300 | $8,680 |
| 2020 | $1,115 | $15,030 | $4,200 | $10,830 |
| 2019 | $1,084 | $15,030 | $4,200 | $10,830 |
| 2018 | $839 | $10,840 | $2,120 | $8,720 |
| 2017 | $836 | $10,840 | $2,120 | $8,720 |
| 2016 | $488 | $5,990 | $1,871 | $4,119 |
| 2015 | $468 | $5,990 | $1,871 | $4,119 |
| 2014 | $331 | $3,980 | $1,106 | $2,874 |
Source: Public Records
Map
Nearby Homes
- 4807 Clayton St
- 4780 Milwaukee St
- 4975 Saint Paul St
- 5123 Milwaukee St
- 4621 N Vasquez Blvd
- 5147 Saint Paul St
- 4647 Josephine St
- 4790 Vine St
- 4768 Vine St Unit 4770
- 4768 Vine St Unit 4768-4770
- 4774 Vine St
- 4525 Milwaukee St Unit 2242-21-016
- 4751 Vine St
- 4507 Josephine St
- 4447 Thompson Ct
- 4718 High St
- 4400 Clayton St
- 4666 Race St
- 4650 Race St
- 4720 High St
- 4909 Clayton St
- 4919 Clayton St
- 4921 Clayton St
- 4905 Clayton St
- 4925 Clayton St
- 4901 Clayton St
- 4927 Clayton St
- 4914 Clayton St
- 4910 Clayton St
- 4918 Clayton St
- 4904 Clayton St
- 4922 Clayton St
- 4900 Clayton St
- 2690 E 49th Ave
- 4930 Clayton St Unit 4932
- 4864 Clayton St
- 4841 Clayton St
- 4953 Clayton St
- 4915 Fillmore St
- 4911 Fillmore St