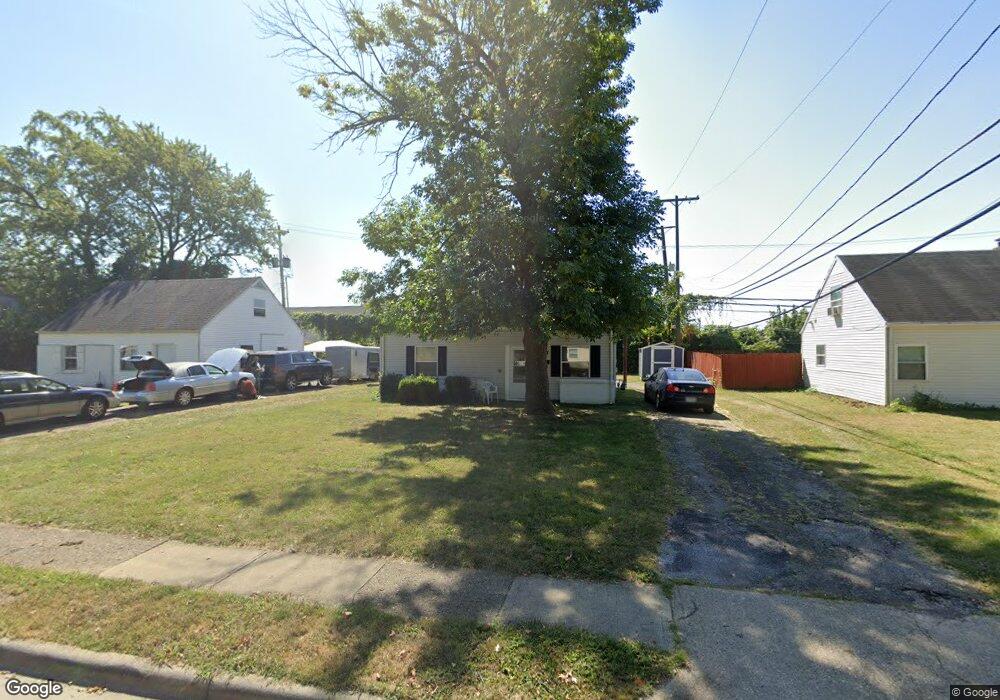
4915 Dimson Dr S Columbus, OH 43213
Estimated Value: $153,000 - $166,000
3
Beds
1
Bath
1,054
Sq Ft
$150/Sq Ft
Est. Value
About This Home
This home is located at 4915 Dimson Dr S, Columbus, OH 43213 and is currently estimated at $158,269, approximately $150 per square foot. 4915 Dimson Dr S is a home located in Franklin County with nearby schools including Etna Road Elementary School, Beechwood Elementary School, and Rosemore Middle School.
Ownership History
Date
Name
Owned For
Owner Type
Purchase Details
Closed on
Jan 10, 2014
Sold by
West Patrick W
Bought by
West Herbert Patrick and West Patrick Herbert
Current Estimated Value
Purchase Details
Closed on
May 10, 2013
Sold by
West Michele R
Bought by
West Patrick H
Home Financials for this Owner
Home Financials are based on the most recent Mortgage that was taken out on this home.
Original Mortgage
$63,300
Outstanding Balance
$46,848
Interest Rate
4.5%
Mortgage Type
New Conventional
Estimated Equity
$111,421
Purchase Details
Closed on
Dec 8, 2004
Sold by
Merriman Monica R
Bought by
West Patrick H and West Michele R
Home Financials for this Owner
Home Financials are based on the most recent Mortgage that was taken out on this home.
Original Mortgage
$62,900
Interest Rate
5.84%
Mortgage Type
Credit Line Revolving
Purchase Details
Closed on
Sep 1, 1995
Sold by
Smith William R
Bought by
Merriman Group Inc
Home Financials for this Owner
Home Financials are based on the most recent Mortgage that was taken out on this home.
Original Mortgage
$388,000
Interest Rate
7.55%
Mortgage Type
New Conventional
Purchase Details
Closed on
Oct 28, 1988
Create a Home Valuation Report for This Property
The Home Valuation Report is an in-depth analysis detailing your home's value as well as a comparison with similar homes in the area
Home Values in the Area
Average Home Value in this Area
Purchase History
| Date | Buyer | Sale Price | Title Company |
|---|---|---|---|
| West Herbert Patrick | -- | Valmer Land Title Agency Box | |
| West Patrick H | -- | Vlmer Land Title Agency Box | |
| West Patrick H | $69,900 | Valmer Land | |
| Merriman Group Inc | $324,000 | -- | |
| -- | -- | -- |
Source: Public Records
Mortgage History
| Date | Status | Borrower | Loan Amount |
|---|---|---|---|
| Open | West Patrick H | $63,300 | |
| Closed | West Patrick H | $62,900 | |
| Closed | Merriman Group Inc | $388,000 |
Source: Public Records
Tax History Compared to Growth
Tax History
| Year | Tax Paid | Tax Assessment Tax Assessment Total Assessment is a certain percentage of the fair market value that is determined by local assessors to be the total taxable value of land and additions on the property. | Land | Improvement |
|---|---|---|---|---|
| 2024 | $2,180 | $48,690 | $14,180 | $34,510 |
| 2023 | $2,165 | $48,685 | $14,175 | $34,510 |
| 2022 | $1,376 | $23,520 | $6,300 | $17,220 |
| 2021 | $1,294 | $23,520 | $6,300 | $17,220 |
| 2020 | $1,282 | $23,520 | $6,300 | $17,220 |
| 2019 | $1,143 | $18,240 | $5,040 | $13,200 |
| 2018 | $1,090 | $18,240 | $5,040 | $13,200 |
| 2017 | $1,056 | $18,240 | $5,040 | $13,200 |
| 2016 | $1,006 | $14,980 | $3,780 | $11,200 |
| 2015 | $1,015 | $14,980 | $3,780 | $11,200 |
| 2014 | $1,015 | $14,980 | $3,780 | $11,200 |
| 2013 | $536 | $16,625 | $4,200 | $12,425 |
Source: Public Records
Map
Nearby Homes
- 4991 Justin Rd
- 931 Antwerp Rd
- 1130 Little Plum Ln
- 855 Dimson Dr E
- 1120 Fairway Blvd
- 1320 Nancy Ln
- 4662 Jae Ave
- 1085 S Hamilton Rd
- 4653 Kae Ave
- 4780 Etna Rd Unit 782
- 547 Country Club Rd
- 1486 Efner Dr
- 686 Fairway Blvd
- 469 Cumberland Dr
- 1281 Maetzel Dr
- 4501 Amesbury Rd
- 571 S Hamilton Rd
- 424 Cumberland Dr
- 4484 Grimsby Rd
- 353 Shell Ct E
- 4923 Dimson Dr S
- 4909 Dimson Dr S
- 4931 Dimson Dr S
- 4903 Dimson Dr S
- 4939 Dimson Dr S
- 4897 Dimson Dr S
- 4920 Dimson Dr S
- 1020 Exeter Rd
- 4928 Dimson Dr S
- 4936 Dimson Dr S
- 4947 Dimson Dr S
- 4944 Dimson Dr S
- 4894 Dimson Dr S
- 4891 Dimson Dr S
- 1016 Duke Rd
- 4955 Dimson Dr S
- 1010 Exeter Rd
- 5000 E Main St
- 1010 Duke Rd
- 1013 Exeter Rd