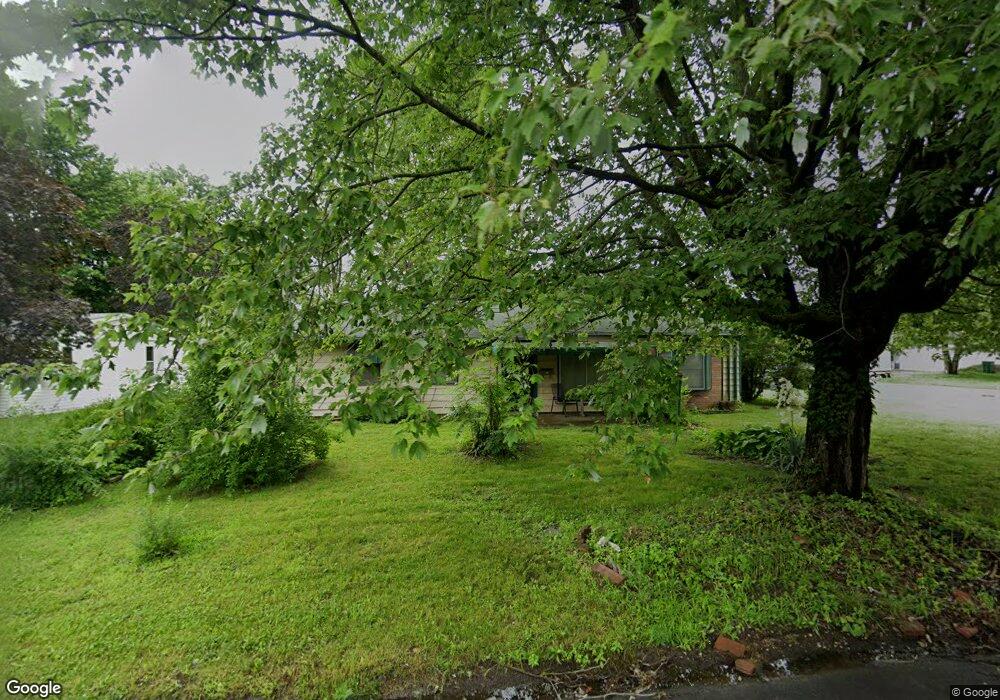
4915 Piggott Ave East Saint Louis, IL 62207
Estimated Value: $36,000 - $71,000
--
Bed
--
Bath
1,225
Sq Ft
$45/Sq Ft
Est. Value
About This Home
This home is located at 4915 Piggott Ave, East Saint Louis, IL 62207 and is currently estimated at $54,781, approximately $44 per square foot. 4915 Piggott Ave is a home located in St. Clair County with nearby schools including Katie Harper-Wright Elementary School, Mason/Clark Middle School, and East St Louis Senior High School.
Ownership History
Date
Name
Owned For
Owner Type
Purchase Details
Closed on
Sep 16, 2025
Sold by
Sanders Melba King
Bought by
Brown Recardo
Current Estimated Value
Purchase Details
Closed on
Sep 11, 2024
Sold by
Brown Recardo M
Bought by
Sanders Melba
Purchase Details
Closed on
Nov 8, 2021
Sold by
Sanders Melba King
Bought by
Brown Recardo
Purchase Details
Closed on
Aug 10, 2018
Sold by
King Shaun and King Melba
Bought by
Sanders Melba King
Purchase Details
Closed on
Oct 3, 2017
Sold by
Falcon Ltd
Bought by
King Shaun and King Melba
Purchase Details
Closed on
Feb 27, 2014
Sold by
Raven Securities Inc
Bought by
Falcon Ltd
Purchase Details
Closed on
Jan 3, 2014
Sold by
County Of Saint Clair
Bought by
Raven Securities Inc
Create a Home Valuation Report for This Property
The Home Valuation Report is an in-depth analysis detailing your home's value as well as a comparison with similar homes in the area
Home Values in the Area
Average Home Value in this Area
Purchase History
| Date | Buyer | Sale Price | Title Company |
|---|---|---|---|
| Brown Recardo | -- | None Available | |
| Sanders Melba | -- | None Available | |
| Brown Recardo | -- | None Available | |
| Sanders Melba King | -- | None Available | |
| King Shaun | $6,500 | None Available | |
| Falcon Ltd | $18,000 | None Available | |
| Raven Securities Inc | -- | None Available |
Source: Public Records
Tax History Compared to Growth
Tax History
| Year | Tax Paid | Tax Assessment Tax Assessment Total Assessment is a certain percentage of the fair market value that is determined by local assessors to be the total taxable value of land and additions on the property. | Land | Improvement |
|---|---|---|---|---|
| 2024 | $1,796 | $11,203 | $828 | $10,375 |
| 2023 | $1,665 | $10,125 | $748 | $9,377 |
| 2022 | $1,552 | $8,874 | $656 | $8,218 |
| 2021 | $443 | $8,409 | $622 | $7,787 |
| 2020 | $516 | $8,807 | $651 | $8,156 |
| 2019 | $534 | $8,807 | $651 | $8,156 |
| 2018 | $570 | $8,936 | $661 | $8,275 |
| 2017 | $569 | $8,721 | $645 | $8,076 |
| 2016 | $666 | $3,260 | $642 | $2,618 |
| 2014 | $252 | $3,225 | $635 | $2,590 |
| 2013 | $200 | $3,025 | $596 | $2,429 |
Source: Public Records
Map
Nearby Homes