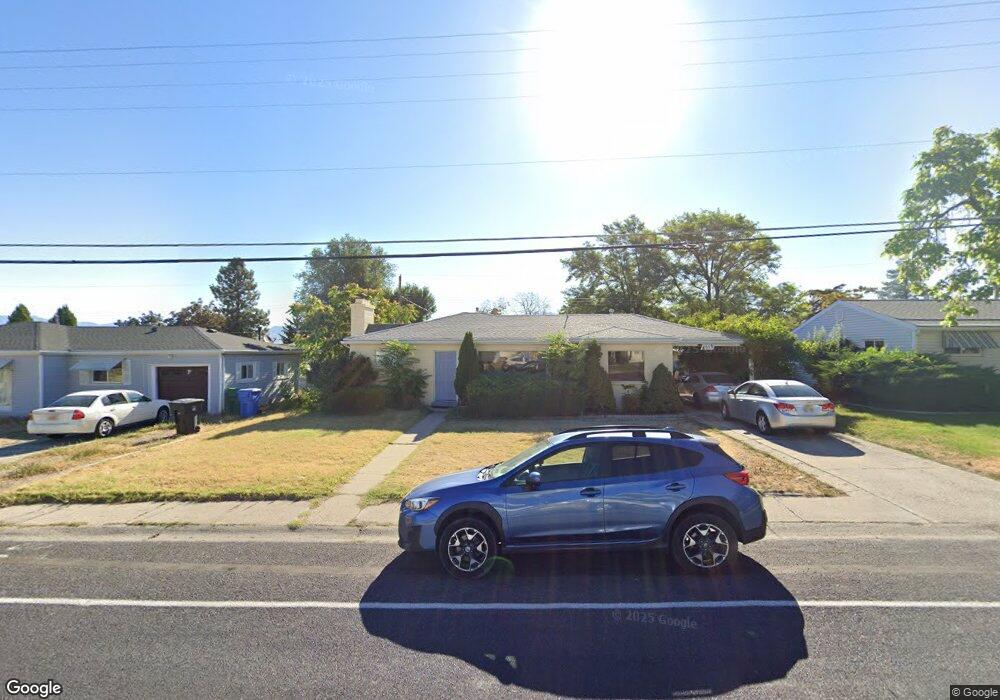
4915 S 4420 W Salt Lake City, UT 84118
Estimated Value: $368,000 - $455,000
4
Beds
2
Baths
2,242
Sq Ft
$188/Sq Ft
Est. Value
About This Home
This home is located at 4915 S 4420 W, Salt Lake City, UT 84118 and is currently estimated at $421,137, approximately $187 per square foot. 4915 S 4420 W is a home located in Salt Lake County with nearby schools including David Gourley Elementary School, Kearns Jr High School, and Kearns High School.
Ownership History
Date
Name
Owned For
Owner Type
Purchase Details
Closed on
Mar 6, 2017
Sold by
Ventnor Avenue Llc
Bought by
Bradley Bryn W
Current Estimated Value
Home Financials for this Owner
Home Financials are based on the most recent Mortgage that was taken out on this home.
Original Mortgage
$228,779
Outstanding Balance
$190,136
Interest Rate
4.25%
Mortgage Type
FHA
Estimated Equity
$231,001
Purchase Details
Closed on
Oct 28, 2016
Sold by
Mcguire Neil Curtis and Cantonwine Carolyn
Bought by
Ventnore Aveneu Llc
Home Financials for this Owner
Home Financials are based on the most recent Mortgage that was taken out on this home.
Original Mortgage
$100,000
Interest Rate
3.5%
Mortgage Type
Purchase Money Mortgage
Purchase Details
Closed on
Apr 29, 2013
Sold by
Mcguire Eileen W
Bought by
Mcguire Eileen W
Purchase Details
Closed on
Dec 13, 2004
Sold by
Mcguire Curtis B and Mcguire Eileen
Bought by
Mcguire Curtis B and Mcguire Eileen W
Create a Home Valuation Report for This Property
The Home Valuation Report is an in-depth analysis detailing your home's value as well as a comparison with similar homes in the area
Home Values in the Area
Average Home Value in this Area
Purchase History
| Date | Buyer | Sale Price | Title Company |
|---|---|---|---|
| Bradley Bryn W | -- | Title One | |
| Ventnore Aveneu Llc | -- | Title One | |
| Mcguire Eileen W | -- | None Available | |
| Mcguire Curtis B | -- | Mountain View Title |
Source: Public Records
Mortgage History
| Date | Status | Borrower | Loan Amount |
|---|---|---|---|
| Open | Bradley Bryn W | $228,779 | |
| Previous Owner | Ventnore Aveneu Llc | $100,000 |
Source: Public Records
Tax History Compared to Growth
Tax History
| Year | Tax Paid | Tax Assessment Tax Assessment Total Assessment is a certain percentage of the fair market value that is determined by local assessors to be the total taxable value of land and additions on the property. | Land | Improvement |
|---|---|---|---|---|
| 2025 | $2,758 | $394,900 | $79,900 | $315,000 |
| 2024 | $2,758 | $371,400 | $75,100 | $296,300 |
| 2023 | $2,570 | $332,400 | $72,100 | $260,300 |
| 2022 | $2,606 | $346,100 | $70,800 | $275,300 |
| 2021 | $2,365 | $284,400 | $54,400 | $230,000 |
| 2020 | $2,236 | $245,000 | $52,200 | $192,800 |
| 2019 | $2,165 | $240,700 | $49,200 | $191,500 |
| 2018 | $2,051 | $220,000 | $49,200 | $170,800 |
| 2017 | $1,582 | $172,200 | $46,800 | $125,400 |
| 2016 | $403 | $145,600 | $43,100 | $102,500 |
| 2015 | $361 | $130,800 | $55,400 | $75,400 |
| 2014 | -- | $119,800 | $51,400 | $68,400 |
Source: Public Records
Map
Nearby Homes