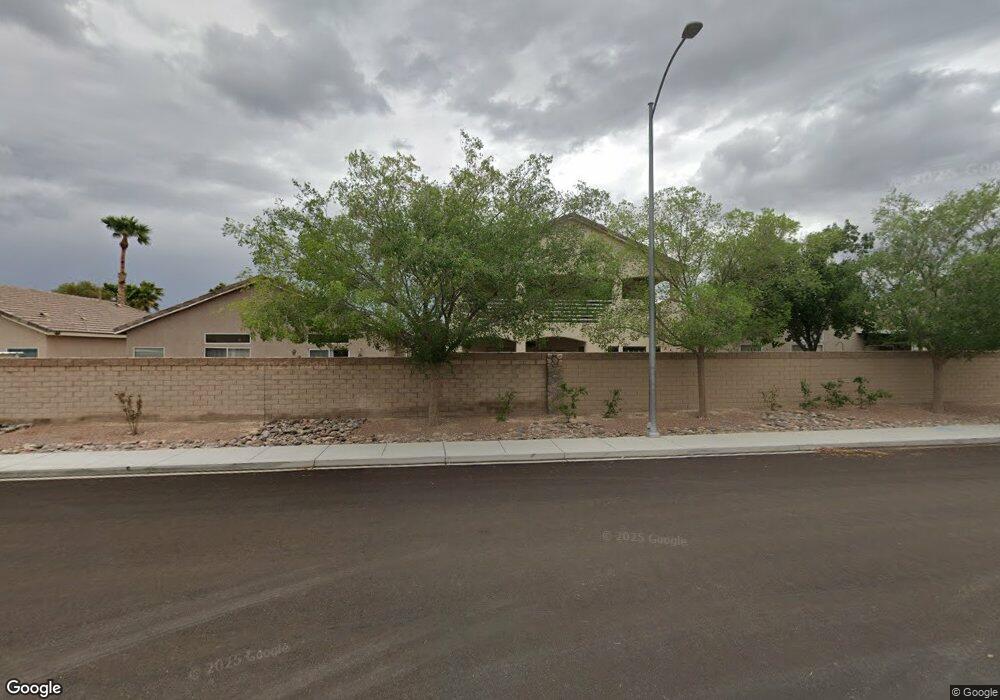
4916 Cascade Pools Ave Unit 9C Las Vegas, NV 89131
Tule Springs NeighborhoodEstimated Value: $467,000 - $560,000
5
Beds
3
Baths
2,740
Sq Ft
$191/Sq Ft
Est. Value
About This Home
This home is located at 4916 Cascade Pools Ave Unit 9C, Las Vegas, NV 89131 and is currently estimated at $523,764, approximately $191 per square foot. 4916 Cascade Pools Ave Unit 9C is a home located in Clark County with nearby schools including Howard E Heckethorn Elementary School, Anthony Saville Middle School, and Shadow Ridge High School.
Ownership History
Date
Name
Owned For
Owner Type
Purchase Details
Closed on
May 29, 2002
Sold by
Ralph Regina D
Bought by
Collmar Martin and Collmar Bridget
Current Estimated Value
Home Financials for this Owner
Home Financials are based on the most recent Mortgage that was taken out on this home.
Original Mortgage
$139,200
Outstanding Balance
$58,940
Interest Rate
6.83%
Estimated Equity
$464,824
Purchase Details
Closed on
Aug 24, 2001
Sold by
Ralph Donald L
Bought by
Ralph Regina L
Home Financials for this Owner
Home Financials are based on the most recent Mortgage that was taken out on this home.
Original Mortgage
$138,950
Interest Rate
7.21%
Create a Home Valuation Report for This Property
The Home Valuation Report is an in-depth analysis detailing your home's value as well as a comparison with similar homes in the area
Home Values in the Area
Average Home Value in this Area
Purchase History
| Date | Buyer | Sale Price | Title Company |
|---|---|---|---|
| Collmar Martin | $174,000 | United Title | |
| Ralph Regina L | -- | Lawyers Title | |
| Ralph Regina D | $173,694 | Lawyers Title |
Source: Public Records
Mortgage History
| Date | Status | Borrower | Loan Amount |
|---|---|---|---|
| Open | Collmar Martin | $139,200 | |
| Previous Owner | Ralph Regina D | $138,950 | |
| Closed | Collmar Martin | $17,400 |
Source: Public Records
Tax History Compared to Growth
Tax History
| Year | Tax Paid | Tax Assessment Tax Assessment Total Assessment is a certain percentage of the fair market value that is determined by local assessors to be the total taxable value of land and additions on the property. | Land | Improvement |
|---|---|---|---|---|
| 2025 | $2,971 | $138,921 | $29,400 | $109,521 |
| 2024 | $2,752 | $138,921 | $29,400 | $109,521 |
| 2023 | $2,752 | $135,647 | $32,200 | $103,447 |
| 2022 | $2,548 | $121,687 | $26,950 | $94,737 |
| 2021 | $2,360 | $113,733 | $23,800 | $89,933 |
| 2020 | $2,188 | $111,516 | $22,400 | $89,116 |
| 2019 | $2,051 | $108,261 | $20,300 | $87,961 |
| 2018 | $1,957 | $100,328 | $16,100 | $84,228 |
| 2017 | $3,271 | $99,771 | $14,350 | $85,421 |
| 2016 | $1,832 | $86,182 | $10,413 | $75,769 |
| 2015 | $1,828 | $71,832 | $8,033 | $63,799 |
| 2014 | $1,775 | $59,094 | $8,925 | $50,169 |
Source: Public Records
Map
Nearby Homes
- 4905 Morning Falls Ave
- 5004 Cascade Pools Ave
- 5001 Morning Falls Ave
- 4832 Whispering Spring Ave
- 5009 Royal Lake Ave
- 7342 N Decatur Blvd Unit 5
- 5047 Naff Ridge Dr
- 7628 Catalina Harbor St
- 7825 Celestial Sky St Unit 2
- 7825 Celestial Sky St Unit 812
- 7620 Catalina Harbor St
- 7830 Celestial Sky St Unit 762
- 7830 Celestial Sky St Unit 763
- 1349 Plan at Juno Pointe
- 1171 Plan at Juno Pointe
- 1600 Plan at Juno Pointe
- 7880 Aurora Sky St Unit 3
- 4821 Whisper Lake Ave
- 7890 Aurora Sky St Unit 1
- 5033 Wild Buffalo Ave
- 4920 Cascade Pools Ave
- 4912 Cascade Pools Ave
- 4924 Cascade Pools Ave
- 4908 Cascade Pools Ave
- 4928 Cascade Pools Ave
- 4904 Cascade Pools Ave
- 4917 Cascade Pools Ave Unit 9C
- 4913 Cascade Pools Ave Unit 9C
- 4921 Cascade Pools Ave Unit 9C
- 4909 Cascade Pools Ave
- 4925 Cascade Pools Ave
- 4932 Cascade Pools Ave
- 5003 Naff Ridge Dr
- 4905 Cascade Pools Ave Unit 9C
- 4905 Cascade Pools Ave
- 4905 Cascade Pools Ave
- 5007 Naff Ridge Dr Unit 2
- 4953 Naff Ridge Dr
- 5011 Naff Ridge Dr
- 4929 Cascade Pools Ave Unit 9C