4916 Daredevil Dr Colorado Springs, CO 80911
Security-Widefield NeighborhoodEstimated Value: $568,549 - $615,000
5
Beds
4
Baths
2,613
Sq Ft
$229/Sq Ft
Est. Value
About This Home
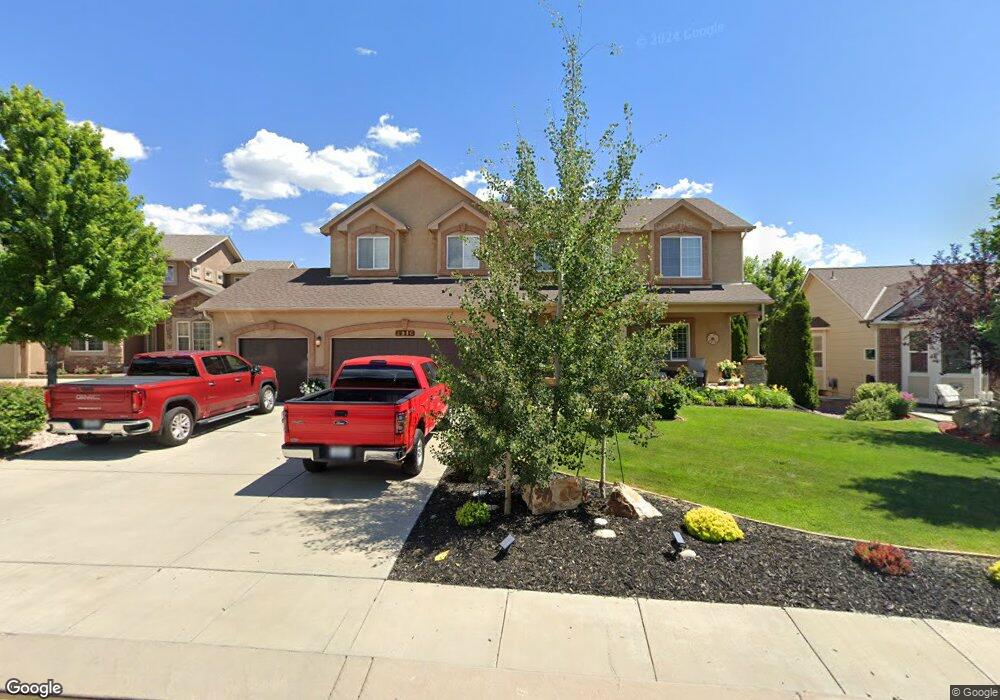
This home is located at 4916 Daredevil Dr, Colorado Springs, CO 80911 and is currently estimated at $598,637, approximately $229 per square foot. 4916 Daredevil Dr is a home located in El Paso County with nearby schools including French Elementary School, Sproul Junior High School, and Widefield High School.
Ownership History
Date
Name
Owned For
Owner Type
Purchase Details
Closed on
Jun 17, 2011
Sold by
King Michael and King Maria
Bought by
Burgess John E
Current Estimated Value
Home Financials for this Owner
Home Financials are based on the most recent Mortgage that was taken out on this home.
Original Mortgage
$276,000
Outstanding Balance
$190,893
Interest Rate
4.7%
Mortgage Type
New Conventional
Estimated Equity
$407,744
Purchase Details
Closed on
Nov 26, 2008
Sold by
Creekstone Development Inc
Bought by
King Michael and King Maria
Home Financials for this Owner
Home Financials are based on the most recent Mortgage that was taken out on this home.
Original Mortgage
$314,636
Interest Rate
5.99%
Mortgage Type
VA
Purchase Details
Closed on
Dec 14, 2007
Sold by
Barnstormers Landing Llc
Bought by
Creekstone Development Inc and Creekstone Homes Inc
Create a Home Valuation Report for This Property
The Home Valuation Report is an in-depth analysis detailing your home's value as well as a comparison with similar homes in the area
Home Values in the Area
Average Home Value in this Area
Purchase History
| Date | Buyer | Sale Price | Title Company |
|---|---|---|---|
| Burgess John E | $345,000 | Heritage Title | |
| King Michael | $345,280 | Cb Title | |
| Creekstone Development Inc | $65,000 | Cb Title |
Source: Public Records
Mortgage History
| Date | Status | Borrower | Loan Amount |
|---|---|---|---|
| Open | Burgess John E | $276,000 | |
| Previous Owner | King Michael | $314,636 |
Source: Public Records
Tax History Compared to Growth
Tax History
| Year | Tax Paid | Tax Assessment Tax Assessment Total Assessment is a certain percentage of the fair market value that is determined by local assessors to be the total taxable value of land and additions on the property. | Land | Improvement |
|---|---|---|---|---|
| 2025 | $2,738 | $40,120 | -- | -- |
| 2024 | $2,708 | $40,320 | $7,320 | $33,000 |
| 2023 | $2,708 | $40,320 | $7,320 | $33,000 |
| 2022 | $2,229 | $29,860 | $5,060 | $24,800 |
| 2021 | $2,404 | $30,720 | $5,210 | $25,510 |
| 2020 | $2,419 | $30,030 | $4,550 | $25,480 |
| 2019 | $2,405 | $30,030 | $4,550 | $25,480 |
| 2018 | $2,168 | $25,260 | $4,330 | $20,930 |
| 2017 | $2,192 | $25,260 | $4,330 | $20,930 |
| 2016 | $1,941 | $27,310 | $4,600 | $22,710 |
| 2015 | $1,990 | $27,310 | $4,600 | $22,710 |
| 2014 | $1,885 | $25,970 | $4,390 | $21,580 |
Source: Public Records
Map
Nearby Homes
- 3640 Tail Wind Dr
- 3642 Red Baron Dr
- 5330 Barnstormers Ave
- 3472 Osprey Ridge Dr
- 3428 Tail Spin Dr
- 3441 Kestrel Dr
- 3484 Astana Dr
- 4803 Tory Ridge Dr
- 3310 Bridgewater Dr
- 4773 Live Oak Dr
- 4929 Raptor Crest Blvd
- 3335 Galleria Terrace
- 4785 Live Oak Dr
- 4801 Live Oak Dr
- 3133 Bursa Dr
- 4882 Hawk Meadow Dr
- 3211 Poughkeepsie Dr
- 4852 Sea Eagle Dr
- 4820 Sea Eagle Dr
- 4511 Sunnyhill Dr
- 4926 Daredevil Dr
- 4906 Daredevil Dr
- 4936 Daredevil Dr
- 4896 Daredevil Dr
- 3442 Spitfire Dr
- 3456 Spitfire Dr
- 3428 Spitfire Dr
- 4927 Daredevil Dr
- 3470 Spitfire Dr
- 4917 Daredevil Dr
- 4886 Daredevil Dr
- 5530 Barnstormers Ave
- 4897 Daredevil Dr
- 5514 Barnstormers Ave
- 4937 Daredevil Dr
- 5522 Barnstormers Ave
- 5506 Barnstormers Ave
- 4947 Daredevil Dr
- 4887 Daredevil Dr
- 4996 Daredevil Dr