Estimated Value: $358,659 - $423,000
Studio
2
Baths
1,496
Sq Ft
$255/Sq Ft
Est. Value
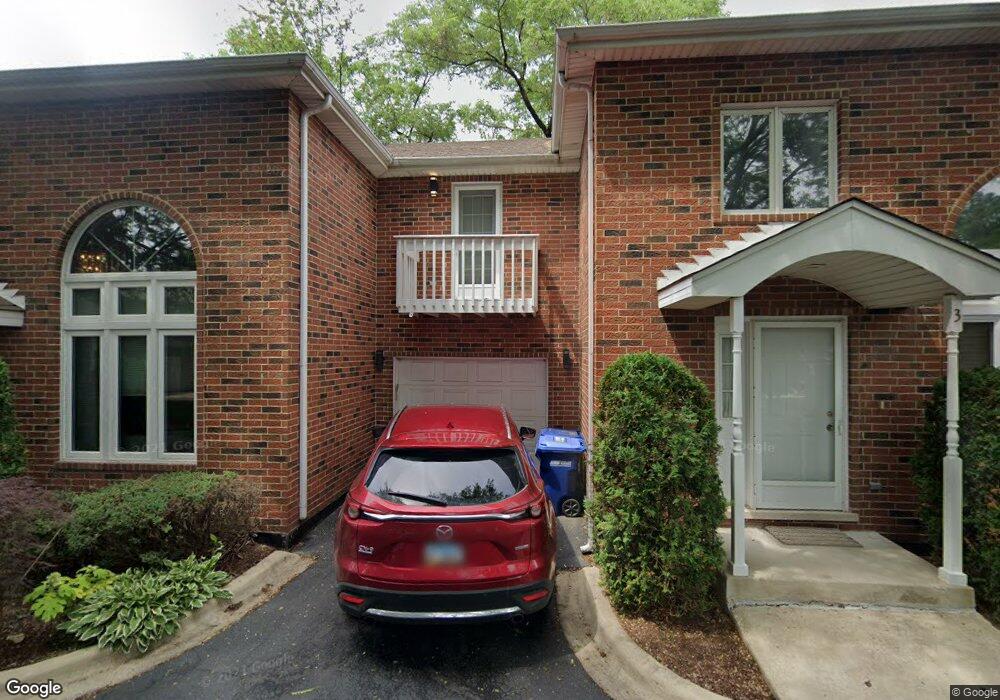
About This Home
This home is located at 4916 Main St Unit B, Lisle, IL 60532 and is currently estimated at $380,915, approximately $254 per square foot. 4916 Main St Unit B is a home located in DuPage County with nearby schools including Lisle Elementary School, Lisle Jr High School, and Lisle High School.
Ownership History
Date
Name
Owned For
Owner Type
Purchase Details
Closed on
Aug 23, 1999
Sold by
Blazek Edward Robert
Bought by
Nendza Richard
Current Estimated Value
Home Financials for this Owner
Home Financials are based on the most recent Mortgage that was taken out on this home.
Original Mortgage
$142,000
Outstanding Balance
$37,945
Interest Rate
6.75%
Mortgage Type
Purchase Money Mortgage
Estimated Equity
$342,970
Purchase Details
Closed on
May 15, 1998
Sold by
Bladek Kristin
Bought by
Blazek Edward Robert
Home Financials for this Owner
Home Financials are based on the most recent Mortgage that was taken out on this home.
Original Mortgage
$130,900
Interest Rate
7.27%
Mortgage Type
Purchase Money Mortgage
Purchase Details
Closed on
Dec 22, 1993
Sold by
Bladek Robert and Bladek Kristen
Bought by
Bladek Kristen
Create a Home Valuation Report for This Property
The Home Valuation Report is an in-depth analysis detailing your home's value as well as a comparison with similar homes in the area
Home Values in the Area
Average Home Value in this Area
Purchase History
| Date | Buyer | Sale Price | Title Company |
|---|---|---|---|
| Nendza Richard | $158,000 | Lawyers Title Insurance Corp | |
| Blazek Edward Robert | $154,000 | -- | |
| Bladek Kristen | -- | -- |
Source: Public Records
Mortgage History
| Date | Status | Borrower | Loan Amount |
|---|---|---|---|
| Open | Nendza Richard | $142,000 | |
| Previous Owner | Blazek Edward Robert | $130,900 |
Source: Public Records
Tax History
| Year | Tax Paid | Tax Assessment Tax Assessment Total Assessment is a certain percentage of the fair market value that is determined by local assessors to be the total taxable value of land and additions on the property. | Land | Improvement |
|---|---|---|---|---|
| 2024 | $7,026 | $104,661 | $17,980 | $86,681 |
| 2023 | $6,719 | $95,520 | $16,410 | $79,110 |
| 2022 | $5,955 | $84,910 | $14,590 | $70,320 |
| 2021 | $5,775 | $81,700 | $14,040 | $67,660 |
| 2020 | $5,533 | $80,230 | $13,790 | $66,440 |
| 2019 | $5,436 | $76,760 | $13,190 | $63,570 |
| 2018 | $5,424 | $76,760 | $13,190 | $63,570 |
| 2017 | $5,366 | $74,170 | $12,740 | $61,430 |
| 2016 | $5,236 | $71,490 | $12,280 | $59,210 |
| 2015 | $5,160 | $67,320 | $11,560 | $55,760 |
| 2014 | $5,353 | $69,070 | $11,580 | $57,490 |
| 2013 | $5,251 | $69,240 | $11,610 | $57,630 |
Source: Public Records
Map
Nearby Homes
- 000 Main St
- 917 Division St
- 4703 Garfield Ave
- 1510A Burlington Ave
- 1002 Ogden Ave
- 4721 Saint Joseph Creek Rd Unit 5F
- 4731 Saint Joseph Creek Rd Unit 4E
- 1632 Ogden Ave
- 752 Ogden Ave
- 748 Ogden Ave
- 1016 Middleton Place Unit 1016
- 6280 Lee Ct
- Lots 11 and 12 Rt 53 and Ogden Ave
- 6284 Lee Ct
- 6260 Lafond Cir
- 6279 Lee Ct
- 6282 Lee Ct
- 6269 Lafond Cir
- 6285 Lee Ct
- 563 Hitchcock Ave
- 4916 Main St Unit 4D
- 4916 Main St Unit 3
- 4916 Main St Unit 1
- 4916 Main St Unit F
- 4916 Main St Unit E
- 4916 Main St Unit 6
- 4916 Main St Unit 4
- 1111 Lisle Place
- 4928 Riedy Place Unit 2B
- 1131 Lisle Place
- 1121 Lisle Place
- 4930 Riedy Place Unit 3B
- 4922 Riedy Place Unit 3A
- 1141 Lisle Place
- 4948 Riedy Place Unit 6C
- 4926 Riedy Place Unit 1B
- 4918 Riedy Place Unit 1A
- 4938 Riedy Place Unit 1C
- 4936 Riedy Place Unit 6B
- 4934 Riedy Place Unit 5B
Your Personal Tour Guide
Ask me questions while you tour the home.