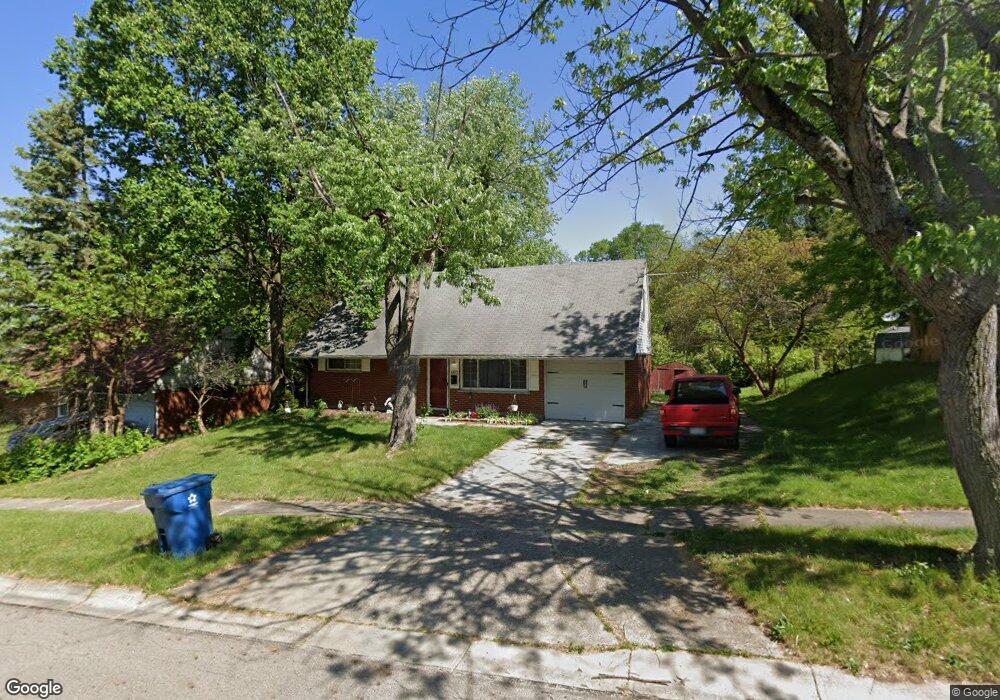
4917 Neptune Ln Dayton, OH 45424
Estimated Value: $158,000 - $204,000
4
Beds
2
Baths
1,308
Sq Ft
$142/Sq Ft
Est. Value
About This Home
This home is located at 4917 Neptune Ln, Dayton, OH 45424 and is currently estimated at $185,610, approximately $141 per square foot. 4917 Neptune Ln is a home located in Montgomery County with nearby schools including Wayne High School and Huber Heights Christian Academy.
Ownership History
Date
Name
Owned For
Owner Type
Purchase Details
Closed on
Sep 24, 2009
Sold by
Thacker Thomas L
Bought by
Rockwell Leah M
Current Estimated Value
Home Financials for this Owner
Home Financials are based on the most recent Mortgage that was taken out on this home.
Original Mortgage
$87,878
Outstanding Balance
$57,704
Interest Rate
5.19%
Mortgage Type
FHA
Estimated Equity
$127,906
Purchase Details
Closed on
Jun 19, 2008
Sold by
Va
Bought by
Thacker Thomas L
Home Financials for this Owner
Home Financials are based on the most recent Mortgage that was taken out on this home.
Original Mortgage
$55,100
Interest Rate
6.5%
Mortgage Type
VA
Purchase Details
Closed on
Apr 3, 2008
Sold by
Simmons John G and Simmons Christine Y
Bought by
Va
Purchase Details
Closed on
Sep 30, 2003
Sold by
Lamb Maud L
Bought by
Simmons John G and Simmons Christine Yvonne
Home Financials for this Owner
Home Financials are based on the most recent Mortgage that was taken out on this home.
Original Mortgage
$91,698
Interest Rate
6.4%
Mortgage Type
VA
Create a Home Valuation Report for This Property
The Home Valuation Report is an in-depth analysis detailing your home's value as well as a comparison with similar homes in the area
Home Values in the Area
Average Home Value in this Area
Purchase History
| Date | Buyer | Sale Price | Title Company |
|---|---|---|---|
| Rockwell Leah M | $89,500 | Attorney | |
| Thacker Thomas L | -- | Titlequest Agency Inc | |
| Va | $50,000 | None Available | |
| Simmons John G | $91,700 | Republic Title Agency Inc |
Source: Public Records
Mortgage History
| Date | Status | Borrower | Loan Amount |
|---|---|---|---|
| Open | Rockwell Leah M | $87,878 | |
| Previous Owner | Thacker Thomas L | $55,100 | |
| Previous Owner | Simmons John G | $91,698 |
Source: Public Records
Tax History Compared to Growth
Tax History
| Year | Tax Paid | Tax Assessment Tax Assessment Total Assessment is a certain percentage of the fair market value that is determined by local assessors to be the total taxable value of land and additions on the property. | Land | Improvement |
|---|---|---|---|---|
| 2024 | $2,184 | $41,860 | $10,010 | $31,850 |
| 2023 | $2,184 | $41,860 | $10,010 | $31,850 |
| 2022 | $1,917 | $29,250 | $7,000 | $22,250 |
| 2021 | $1,967 | $29,250 | $7,000 | $22,250 |
| 2020 | $1,968 | $29,250 | $7,000 | $22,250 |
| 2019 | $1,983 | $26,070 | $7,000 | $19,070 |
| 2018 | $1,989 | $26,070 | $7,000 | $19,070 |
| 2017 | $1,976 | $26,070 | $7,000 | $19,070 |
| 2016 | $1,889 | $24,270 | $7,000 | $17,270 |
| 2015 | $1,864 | $24,270 | $7,000 | $17,270 |
| 2014 | $1,864 | $24,270 | $7,000 | $17,270 |
| 2012 | -- | $25,800 | $8,750 | $17,050 |
Source: Public Records
Map
Nearby Homes
- 5455 Naughton Dr
- 4918 Powell Rd
- 5431 Naughton Dr
- 4825 Nelapark Dr
- 4848 Rittenhouse Dr
- 4309 Kitridge Rd
- 5669 Traymore Dr
- 5365 Mariner Dr
- 4420 Kitridge Rd
- 5062 Nielson Ct
- 5041 Pepper Dr
- 5433 Pentland Cir
- 5660 Tomberg St
- 5059 Key West Dr
- 5630 Botkins Rd
- 5952 Tibet Dr
- 4955 Pennswood Dr
- Juniper with Finished Basement Plan at Heathermere Woods
- 4608 Nowak Ave
- 5230 Monitor Dr
- 4923 Neptune Ln
- 4911 Neptune Ln
- 4929 Neptune Ln
- 4918 Neptune Ln
- 4901 Neptune Ln
- 4912 Neptune Ln
- 5506 Neville St
- 4924 Neptune Ln
- 4906 Neptune Ln
- 5512 Neville St
- 4935 Neptune Ln
- 4930 Neptune Ln
- 4900 Neptune Ln
- 5518 Neville St
- 5473 Naughton Dr
- 5479 Naughton Dr
- 5467 Naughton Dr
- 5497 Naughton Dr
- 4941 Neptune Ln
- 5485 Naughton Dr