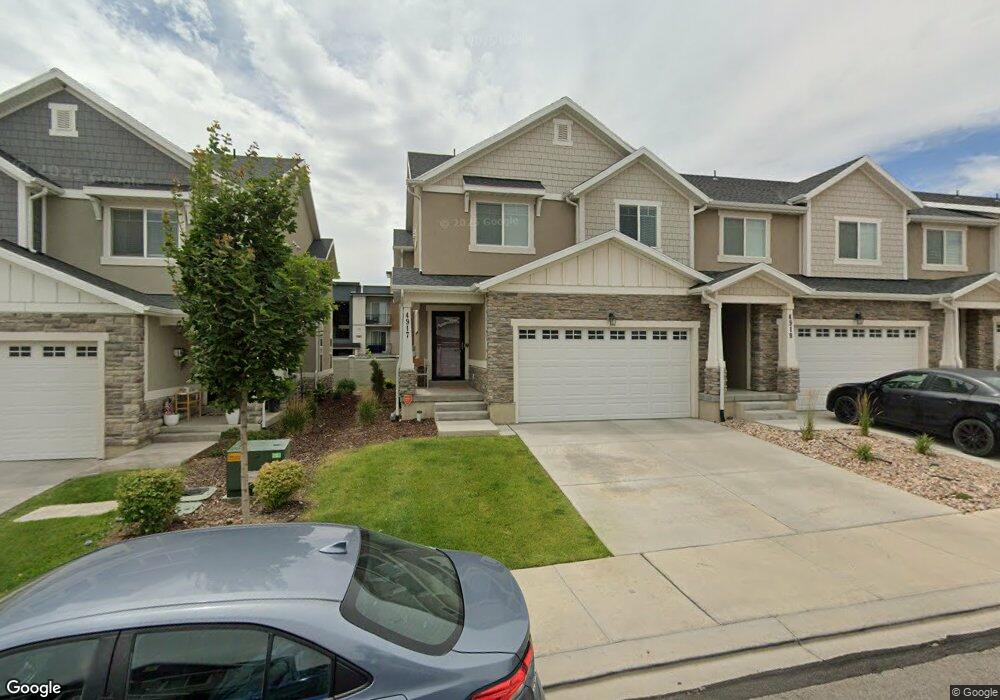
4917 W Pillar Dr Riverton, UT 84096
Estimated Value: $443,000 - $485,000
4
Beds
3
Baths
2,320
Sq Ft
$201/Sq Ft
Est. Value
About This Home
This home is located at 4917 W Pillar Dr, Riverton, UT 84096 and is currently estimated at $466,044, approximately $200 per square foot. 4917 W Pillar Dr is a home located in Salt Lake County with nearby schools including Silver Crest School, Copper Mountain Middle School, and Herriman High School.
Ownership History
Date
Name
Owned For
Owner Type
Purchase Details
Closed on
Apr 12, 2023
Sold by
Ferretti Kevin and Ferretti Tara
Bought by
Grandon Jeffrey F
Current Estimated Value
Home Financials for this Owner
Home Financials are based on the most recent Mortgage that was taken out on this home.
Original Mortgage
$413,150
Outstanding Balance
$401,772
Interest Rate
6.65%
Mortgage Type
New Conventional
Estimated Equity
$64,272
Purchase Details
Closed on
Mar 23, 2017
Sold by
Ferretti Kevin
Bought by
Ferretti Kevin and Ferretti Tara
Home Financials for this Owner
Home Financials are based on the most recent Mortgage that was taken out on this home.
Original Mortgage
$255,290
Interest Rate
4.4%
Mortgage Type
FHA
Purchase Details
Closed on
Mar 8, 2017
Sold by
Wasatch Land Co
Bought by
Ferretti Kevin
Home Financials for this Owner
Home Financials are based on the most recent Mortgage that was taken out on this home.
Original Mortgage
$255,290
Interest Rate
4.4%
Mortgage Type
FHA
Create a Home Valuation Report for This Property
The Home Valuation Report is an in-depth analysis detailing your home's value as well as a comparison with similar homes in the area
Home Values in the Area
Average Home Value in this Area
Purchase History
| Date | Buyer | Sale Price | Title Company |
|---|---|---|---|
| Grandon Jeffrey F | -- | First American Title | |
| Ferretti Kevin | -- | Provo Land Title Co | |
| Ferretti Kevin | -- | Provo Land Title Co |
Source: Public Records
Mortgage History
| Date | Status | Borrower | Loan Amount |
|---|---|---|---|
| Open | Grandon Jeffrey F | $413,150 | |
| Previous Owner | Ferretti Kevin | $255,290 |
Source: Public Records
Tax History Compared to Growth
Tax History
| Year | Tax Paid | Tax Assessment Tax Assessment Total Assessment is a certain percentage of the fair market value that is determined by local assessors to be the total taxable value of land and additions on the property. | Land | Improvement |
|---|---|---|---|---|
| 2025 | $2,632 | $470,700 | $66,700 | $404,000 |
| 2024 | $2,632 | $455,600 | $64,400 | $391,200 |
| 2023 | $2,544 | $415,100 | $56,500 | $358,600 |
| 2022 | $2,644 | $423,200 | $55,400 | $367,800 |
| 2021 | $2,370 | $337,700 | $42,600 | $295,100 |
| 2020 | $2,172 | $288,600 | $42,600 | $246,000 |
| 2019 | $2,136 | $279,000 | $42,600 | $236,400 |
| 2018 | $1,991 | $256,100 | $39,800 | $216,300 |
| 2017 | $749 | $93,900 | $39,800 | $54,100 |
Source: Public Records
Map
Nearby Homes
- 4933 W Pillar Dr
- 13221 S Dominica Ln Unit 303
- 13032 S Tortola Dr Unit 201
- 4967 W Berry Creek Dr
- 5002 W Ticoa Ln
- 13272 S Herriman Rose Blvd
- 13194 S Fort Herriman Pkwy Unit 44
- 13129 S Keegan Dr
- 13184 Newbridge Ln
- 5172 W Newbridge Ln
- 5141 W Arley Ct
- 5149 W Arley Ct
- 13207 S Weatherford Ln
- 12801 Stormy Meadow Dr
- 13269 S Meadowside Dr
- 12779 S Snow Flower Ct
- 5251 W Linley Ct
- 5289 W van Dyne Ln
- 13497 S Mimosa Cir
- 13492 Leaf Wing Ln
- 4917 W Pillar Dr Unit 109
- 4919 W Pillar Dr Unit 108
- 4911 W Pillar Dr Unit 110
- 4911 W Pillar Dr
- 4923 W Pillar Dr Unit 107
- 4923 W Pillar Dr
- 4909 W Pillar Dr Unit 111
- 4925 W Pillar Dr Unit 106
- 4903 W Pillar Dr Unit 112
- 4933 W Pillar Dr Unit 105
- 4899 W Pillar Dr Unit 113
- 4916 W Pillar Dr Unit 100
- 4918 W Pillar Dr
- 4918 W Pillar Dr Unit 101
- 4910 W Pillar Dr Unit 99
- 4922 W Pillar Dr Unit 102
- 4922 W Pillar Dr
- 4908 W Pillar Dr Unit 98
- 4926 W Pillar Dr Unit 103
- 4891 W Pillar Dr Unit 114