4917 Walden Lake Square Unit 39 Decatur, GA 30035
Southwest DeKalb NeighborhoodEstimated Value: $173,000 - $177,000
3
Beds
3
Baths
1,456
Sq Ft
$120/Sq Ft
Est. Value
About This Home
This home is located at 4917 Walden Lake Square Unit 39, Decatur, GA 30035 and is currently estimated at $174,148, approximately $119 per square foot. 4917 Walden Lake Square Unit 39 is a home located in DeKalb County with nearby schools including Fairington Elementary School, Miller Grove Middle School, and Miller Grove High School.
Ownership History
Date
Name
Owned For
Owner Type
Purchase Details
Closed on
Oct 7, 2024
Sold by
Reven Housing Funding I Llc
Bought by
Flipside 4 Llc
Current Estimated Value
Purchase Details
Closed on
Dec 20, 2013
Sold by
Hp Sfr I Llc
Bought by
Golden Alliance Management Llc
Purchase Details
Closed on
May 2, 2013
Sold by
Golden Alliance Management
Bought by
Hp Sfr I Llc
Purchase Details
Closed on
Jun 5, 2012
Sold by
Hutchinson Vickie
Bought by
Golden Alliance Management Llc
Purchase Details
Closed on
May 14, 2004
Sold by
S-Walden Construct Co Llc
Bought by
Hutchinson Vickie
Home Financials for this Owner
Home Financials are based on the most recent Mortgage that was taken out on this home.
Original Mortgage
$113,399
Interest Rate
5.89%
Mortgage Type
VA
Create a Home Valuation Report for This Property
The Home Valuation Report is an in-depth analysis detailing your home's value as well as a comparison with similar homes in the area
Home Values in the Area
Average Home Value in this Area
Purchase History
| Date | Buyer | Sale Price | Title Company |
|---|---|---|---|
| Flipside 4 Llc | $2,508,920 | -- | |
| Golden Alliance Management Llc | $51,000 | -- | |
| Hp Sfr I Llc | $2,160,000 | -- | |
| Golden Alliance Management Llc | $30,000 | -- | |
| Hutchinson Vickie | $117,000 | -- |
Source: Public Records
Mortgage History
| Date | Status | Borrower | Loan Amount |
|---|---|---|---|
| Previous Owner | Hutchinson Vickie | $113,399 |
Source: Public Records
Tax History Compared to Growth
Tax History
| Year | Tax Paid | Tax Assessment Tax Assessment Total Assessment is a certain percentage of the fair market value that is determined by local assessors to be the total taxable value of land and additions on the property. | Land | Improvement |
|---|---|---|---|---|
| 2025 | $3,519 | $79,360 | $19,840 | $59,520 |
| 2024 | $3,521 | $79,360 | $20,000 | $59,360 |
| 2023 | $3,521 | $83,040 | $20,000 | $63,040 |
| 2022 | $2,654 | $59,920 | $4,800 | $55,120 |
| 2021 | $1,527 | $34,240 | $4,794 | $29,446 |
| 2020 | $1,527 | $34,240 | $4,794 | $29,446 |
| 2019 | $1,527 | $34,240 | $4,800 | $29,440 |
| 2018 | $994 | $24,932 | $4,342 | $20,590 |
| 2017 | $1,005 | $22,240 | $3,336 | $18,904 |
| 2016 | $1,007 | $22,240 | $3,336 | $18,904 |
| 2014 | $897 | $19,280 | $3,400 | $15,880 |
Source: Public Records
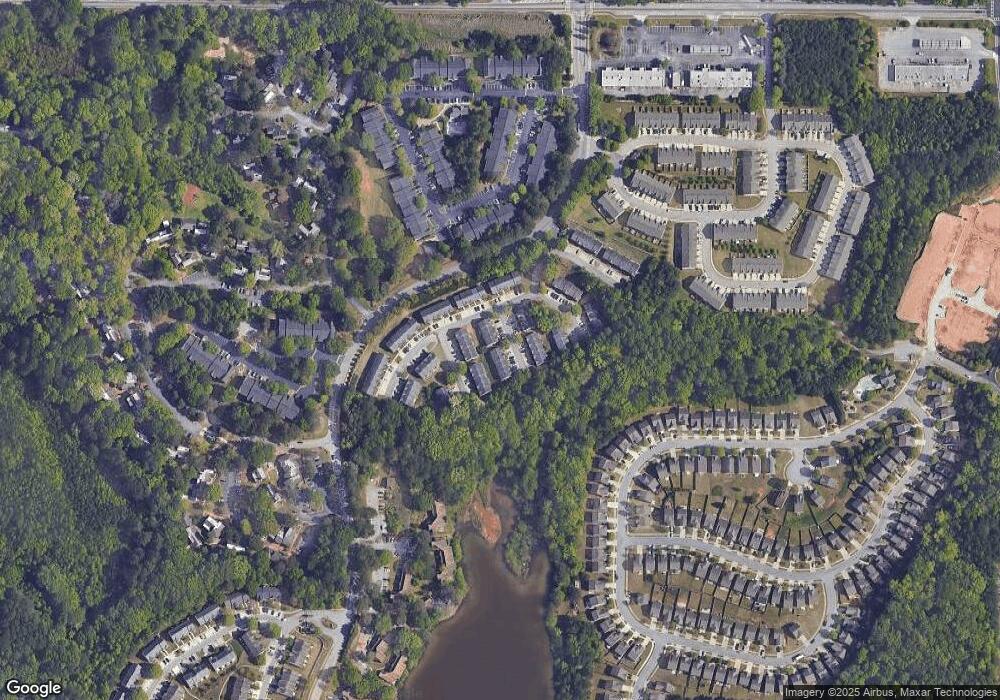
Map
Nearby Homes
- 2566 Walden Lake Dr
- 4917 Walden Lake Square
- 2537 Walden Lake Dr
- 2504 Walden Lake Dr
- 2502 Walden Lake Dr
- 2754 Shellbark Rd
- 29 Quail Run Unit B
- 5004 Jack Dr
- 2742 Snapfinger Manor Unit 128
- 9 Quail Run
- 2744 Snapfinger Manor
- 7 Quail Run
- 4 Quail Run
- 20 Quail Run
- 2763 Snapfinger Manor
- 2693 Avanti Way
- 5027 Jack Dr
- 4919 Walden Lake Square Unit 38
- 4919 Walden Lake Square
- 4915 Walden Lake Square Unit 40
- 4915 Walden Lake Square
- 4913 Walden Lake Square
- 4923 Walden Lake Square
- 4911 Walden Lake Square
- 4828 Walden Lake Pointe Unit 48
- 4830 Walden Lake Pointe Unit 49
- 4830 Walden Lake Point
- 4830 Walden Lake Pte
- 4830 Walden Lake
- 4925 Walden Lake Square
- 4826 Walden Lake Pointe Unit 47
- 4832 Walden Lake Point
- 4832 Walden Lake
- 4832 Walden Lake Pte
- 4909 Walden Lake Square Unit 43
- 4824 Walden Lake Pointe Unit 46
- 4824 Walden Lake Point