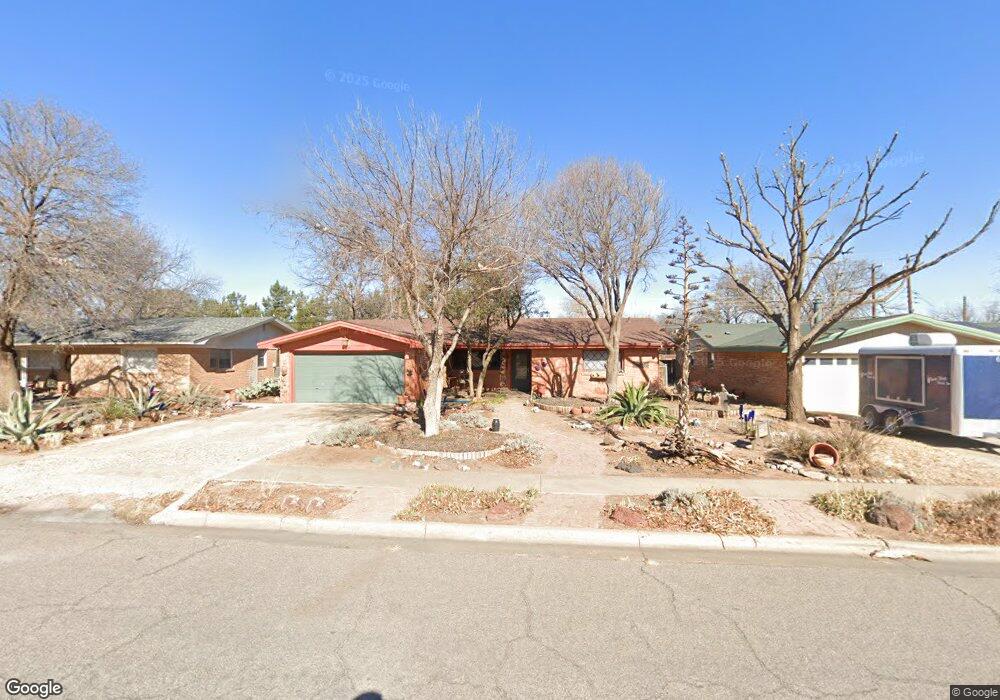
4918 18th St Lubbock, TX 79416
West Campus NeighborhoodEstimated Value: $189,000 - $305,000
3
Beds
2
Baths
1,815
Sq Ft
$123/Sq Ft
Est. Value
About This Home
This home is located at 4918 18th St, Lubbock, TX 79416 and is currently estimated at $223,229, approximately $122 per square foot. 4918 18th St is a home located in Lubbock County with nearby schools including Rush Elementary School, Mackenzie Middle School, and Coronado High School.
Ownership History
Date
Name
Owned For
Owner Type
Purchase Details
Closed on
Jan 26, 2023
Sold by
Sanders Rosalee
Bought by
Beck Christina and Beck Christian
Current Estimated Value
Purchase Details
Closed on
Mar 21, 2008
Sold by
Beck Janette
Bought by
Sanders Rosalee
Home Financials for this Owner
Home Financials are based on the most recent Mortgage that was taken out on this home.
Original Mortgage
$80,000
Interest Rate
5.72%
Mortgage Type
Purchase Money Mortgage
Purchase Details
Closed on
Mar 12, 2007
Sold by
Jacobo Simon H
Bought by
Beck Janette and Sanders Rosalee
Home Financials for this Owner
Home Financials are based on the most recent Mortgage that was taken out on this home.
Original Mortgage
$80,000
Interest Rate
6.25%
Mortgage Type
Purchase Money Mortgage
Purchase Details
Closed on
May 5, 2004
Sold by
Jacobo Paulina M
Bought by
Sanders Rosalee
Create a Home Valuation Report for This Property
The Home Valuation Report is an in-depth analysis detailing your home's value as well as a comparison with similar homes in the area
Home Values in the Area
Average Home Value in this Area
Purchase History
| Date | Buyer | Sale Price | Title Company |
|---|---|---|---|
| Beck Christina | -- | None Listed On Document | |
| Sanders Rosalee | -- | Stewart Title | |
| Beck Janette | -- | None Available | |
| Sanders Rosalee | -- | -- |
Source: Public Records
Mortgage History
| Date | Status | Borrower | Loan Amount |
|---|---|---|---|
| Previous Owner | Sanders Rosalee | $80,000 | |
| Previous Owner | Beck Janette | $80,000 |
Source: Public Records
Tax History
| Year | Tax Paid | Tax Assessment Tax Assessment Total Assessment is a certain percentage of the fair market value that is determined by local assessors to be the total taxable value of land and additions on the property. | Land | Improvement |
|---|---|---|---|---|
| 2025 | $741 | $200,158 | $28,000 | $172,158 |
| 2024 | $35 | $192,015 | $8,892 | $183,123 |
| 2023 | $3,310 | $178,054 | $8,892 | $169,162 |
| 2022 | $3,277 | $161,867 | $8,892 | $166,675 |
| 2021 | $3,151 | $147,152 | $8,892 | $138,260 |
| 2020 | $2,992 | $137,617 | $8,892 | $128,725 |
| 2019 | $2,961 | $131,896 | $8,892 | $123,004 |
| 2018 | $2,815 | $125,221 | $8,892 | $116,329 |
| 2017 | $2,733 | $121,413 | $8,892 | $112,521 |
| 2016 | $2,484 | $110,375 | $8,892 | $101,483 |
| 2015 | $1,382 | $100,341 | $8,892 | $91,449 |
| 2014 | $1,382 | $100,341 | $8,892 | $91,449 |
Source: Public Records
Map
Nearby Homes
Your Personal Tour Guide
Ask me questions while you tour the home.