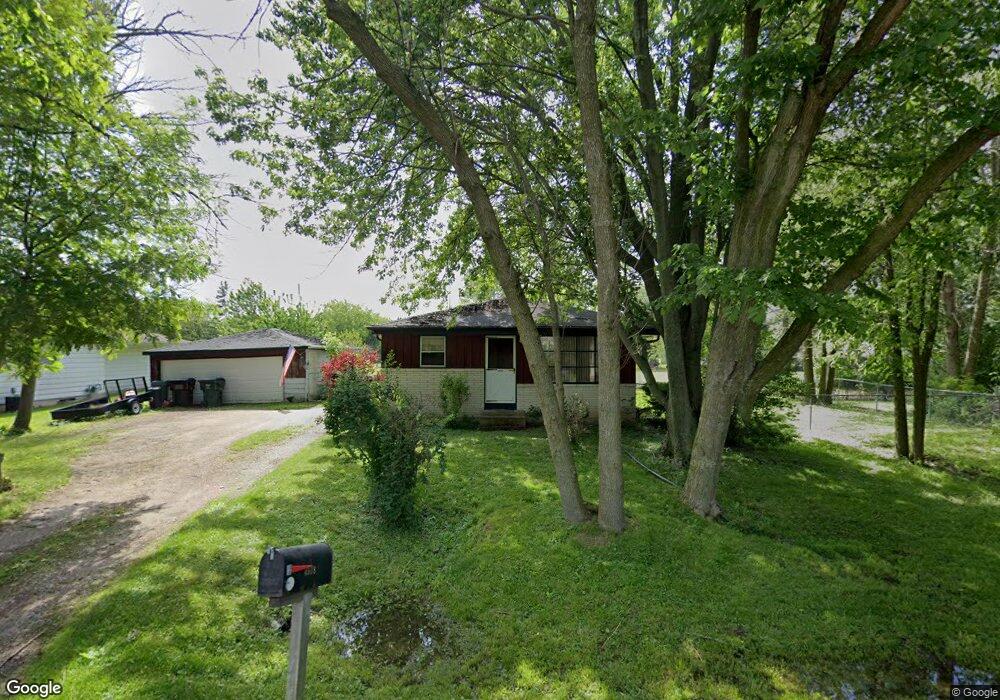
4918 Parry Ave Racine, WI 53402
Estimated Value: $254,000 - $269,000
3
Beds
1
Bath
1,052
Sq Ft
$249/Sq Ft
Est. Value
About This Home
This home is located at 4918 Parry Ave, Racine, WI 53402 and is currently estimated at $261,998, approximately $249 per square foot. 4918 Parry Ave is a home located in Racine County with nearby schools including North Park Elementary School, Olympia Brown Elementary School, and Jerstad-Agerholm Middle School.
Ownership History
Date
Name
Owned For
Owner Type
Purchase Details
Closed on
Jul 24, 2012
Sold by
Constable Robert A
Bought by
Constable Robert A and Constable Patricia L
Current Estimated Value
Home Financials for this Owner
Home Financials are based on the most recent Mortgage that was taken out on this home.
Original Mortgage
$81,250
Outstanding Balance
$34,760
Interest Rate
3.73%
Mortgage Type
New Conventional
Estimated Equity
$227,238
Purchase Details
Closed on
Feb 2, 2007
Sold by
Constable Richard C
Bought by
Constable Robert A
Home Financials for this Owner
Home Financials are based on the most recent Mortgage that was taken out on this home.
Original Mortgage
$88,500
Interest Rate
6.23%
Mortgage Type
New Conventional
Purchase Details
Closed on
Jan 31, 2007
Sold by
Hostetler Jane
Bought by
Constable Robert A
Home Financials for this Owner
Home Financials are based on the most recent Mortgage that was taken out on this home.
Original Mortgage
$88,500
Interest Rate
6.23%
Mortgage Type
New Conventional
Create a Home Valuation Report for This Property
The Home Valuation Report is an in-depth analysis detailing your home's value as well as a comparison with similar homes in the area
Home Values in the Area
Average Home Value in this Area
Purchase History
| Date | Buyer | Sale Price | Title Company |
|---|---|---|---|
| Constable Robert A | -- | None Available | |
| Constable Robert A | $43,000 | -- | |
| Constable Robert A | $43,000 | -- |
Source: Public Records
Mortgage History
| Date | Status | Borrower | Loan Amount |
|---|---|---|---|
| Open | Constable Robert A | $81,250 | |
| Closed | Constable Robert A | $88,500 | |
| Closed | Constable Robert A | $88,500 |
Source: Public Records
Tax History Compared to Growth
Tax History
| Year | Tax Paid | Tax Assessment Tax Assessment Total Assessment is a certain percentage of the fair market value that is determined by local assessors to be the total taxable value of land and additions on the property. | Land | Improvement |
|---|---|---|---|---|
| 2024 | $3,242 | $213,800 | $33,200 | $180,600 |
| 2023 | $3,162 | $198,300 | $33,200 | $165,100 |
| 2022 | $2,931 | $189,400 | $33,200 | $156,200 |
| 2021 | $2,737 | $162,300 | $33,200 | $129,100 |
| 2020 | $2,573 | $130,400 | $29,500 | $100,900 |
| 2019 | $2,387 | $130,400 | $29,500 | $100,900 |
| 2018 | $2,159 | $105,300 | $29,500 | $75,800 |
| 2017 | $2,177 | $105,300 | $29,500 | $75,800 |
| 2016 | $2,139 | $110,100 | $29,500 | $80,600 |
| 2015 | $2,089 | $110,100 | $29,500 | $80,600 |
| 2014 | $2,006 | $110,100 | $29,500 | $80,600 |
| 2013 | $2,256 | $110,100 | $29,500 | $80,600 |
Source: Public Records
Map
Nearby Homes
- 1426 Johnson Ave
- 1533 Kremer Ave
- 1838 Johnson Ave
- 1732 Kremer Ave
- 5450 Charles St
- 5418 N Meadows Dr
- 4418 Douglas Ave
- 601 4 Mile Rd
- 1519 Tiffany Dr
- 5536 Whirlaway Ln
- 5535 N Meadows Dr
- 4218 Lasalle St
- 419 4 Mile Rd
- 5640 Richwood Ln
- 1933 Newberry Ln
- 1720 Newberry Ln
- Windsor Plan at Creekview Estates
- Scottsdale Plan at Creekview Estates
- Eaton Plan at Creekview Estates
- Ellington Plan at Creekview Estates
- 4910 Parry Ave
- 1709 4 Mile Rd
- 4925 Parry Ave
- 1701 4 Mile Rd
- 4933 Parry Ave
- 4919 Parry Ave
- 1723 4 Mile Rd
- 4906 Parry Ave
- 1550 Wind Dale Dr
- 4941 Parry Ave
- 4909 Parry Ave
- 1608 Wind Dale Dr
- 1605 4 Mile Rd
- 4930 Tanglewood Ave
- 4922 Tanglewood Ave
- 4901 Parry Ave
- 1618 Wind Dale Dr
- 4934 Tanglewood Ave
- 4914 Tanglewood Ave
- 1523 4 Mile Rd