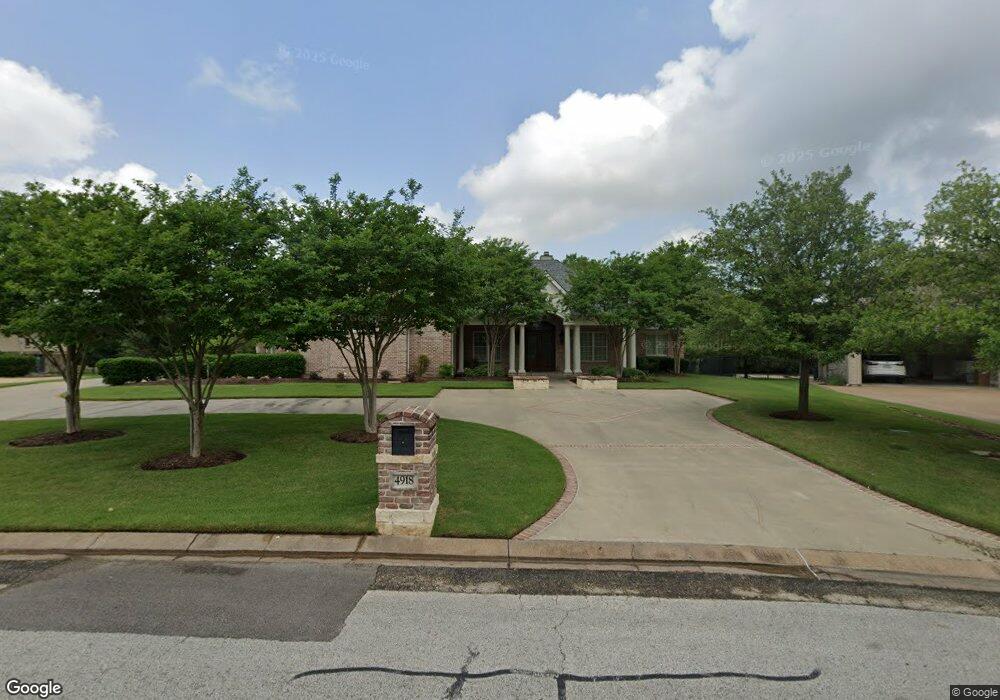
4918 Whistling Straits Loop College Station, TX 77845
Pebble Creek NeighborhoodEstimated Value: $1,282,000 - $1,544,000
3
Beds
2
Baths
4,995
Sq Ft
$279/Sq Ft
Est. Value
About This Home
This home is located at 4918 Whistling Straits Loop, College Station, TX 77845 and is currently estimated at $1,391,413, approximately $278 per square foot. 4918 Whistling Straits Loop is a home with nearby schools including A&M Consolidated Middle School, Oakwood Intermediate School, and A&M Consolidated High School.
Ownership History
Date
Name
Owned For
Owner Type
Purchase Details
Closed on
Nov 1, 2010
Sold by
Kraus Trevor T and Kraus Jamie B
Bought by
Stonecipher James V and Stonecipher Melanie Kay
Current Estimated Value
Home Financials for this Owner
Home Financials are based on the most recent Mortgage that was taken out on this home.
Original Mortgage
$190,000
Outstanding Balance
$125,933
Interest Rate
4.36%
Mortgage Type
Purchase Money Mortgage
Estimated Equity
$1,265,480
Purchase Details
Closed on
Mar 13, 2006
Sold by
Pebble Creek Development Company
Bought by
Kraus Trevor T and Kraus Jamie B
Home Financials for this Owner
Home Financials are based on the most recent Mortgage that was taken out on this home.
Original Mortgage
$225,000
Interest Rate
6.19%
Mortgage Type
Purchase Money Mortgage
Create a Home Valuation Report for This Property
The Home Valuation Report is an in-depth analysis detailing your home's value as well as a comparison with similar homes in the area
Home Values in the Area
Average Home Value in this Area
Purchase History
| Date | Buyer | Sale Price | Title Company |
|---|---|---|---|
| Stonecipher James V | -- | None Available | |
| Kraus Trevor T | -- | University Title Company |
Source: Public Records
Mortgage History
| Date | Status | Borrower | Loan Amount |
|---|---|---|---|
| Open | Stonecipher James V | $190,000 | |
| Previous Owner | Kraus Trevor T | $225,000 |
Source: Public Records
Tax History Compared to Growth
Tax History
| Year | Tax Paid | Tax Assessment Tax Assessment Total Assessment is a certain percentage of the fair market value that is determined by local assessors to be the total taxable value of land and additions on the property. | Land | Improvement |
|---|---|---|---|---|
| 2025 | $24,196 | $1,438,554 | $278,536 | $1,160,018 |
| 2024 | $24,196 | $1,338,739 | $253,606 | $1,085,133 |
| 2023 | $24,196 | $1,230,925 | $230,394 | $1,000,531 |
| 2022 | $23,859 | $1,119,023 | $209,475 | $909,548 |
| 2021 | $26,129 | $1,156,869 | $196,007 | $960,862 |
| 2020 | $24,152 | $1,063,435 | $196,007 | $867,428 |
| 2019 | $27,093 | $1,146,620 | $196,010 | $950,610 |
| 2018 | $27,752 | $1,165,790 | $179,670 | $986,120 |
| 2017 | $25,700 | $1,092,010 | $179,670 | $912,340 |
| 2016 | $25,501 | $1,083,520 | $179,670 | $903,850 |
| 2015 | $19,746 | $1,000,000 | $179,670 | $820,330 |
| 2014 | $19,746 | $852,060 | $203,170 | $648,890 |
Source: Public Records
Map
Nearby Homes
- 1929 Spanish Moss Dr
- 2020 Pebble Bend Dr
- 2035 Pebble Bend Dr
- 5115 Bellerive Bend Dr
- 2033 Pebble Bend Dr
- 4701 Coral Berry Cove
- 1411 Royal Adelade Dr
- 2032 Pebble Bend Dr
- 5106 Bellerive Bend Dr
- 2038 Pebble Bend Dr
- 5211 Flint Hills Dr
- 4804 Crooked Branch Dr
- 4902 Augusta Cir
- 1441 Royal Adelade Dr
- 4906 Williams Ridge Ct
- 5111 Sycamore Hills Dr
- 904 Plainfield Ct
- 4906 Ginger Ct
- 5206 Sycamore Hills Ct
- 4727 Johnson Creek Loop
- 4920 Whistling Straits Loop
- 4916 Whistling Straits Loop
- 4917 Whistling Straits Loop
- 4915 Whistling Straits Loop
- 4922 Whistling Straits Loop
- 4914 Whistling Straits Loop
- 4913 Whistling Straits Loop
- 4921 Whistling Straits Loop
- 4924 Whistling Straits Loop
- 4923 Whistling Straits Loop
- 4911 Whistling Straits Loop
- 4912 Whistling Straits Loop
- 4900 Somerset Hills Ct
- 4902 Somerset Hills Ct
- 4910 Whistling Straits Loop
- 4925 Whistling Straits Loop
- 4926 Whistling Straits Loop
- 4909 Whistling Straits Loop
- 4901 Somerset Hills Ct
- 4908 Whistling Straits Loop