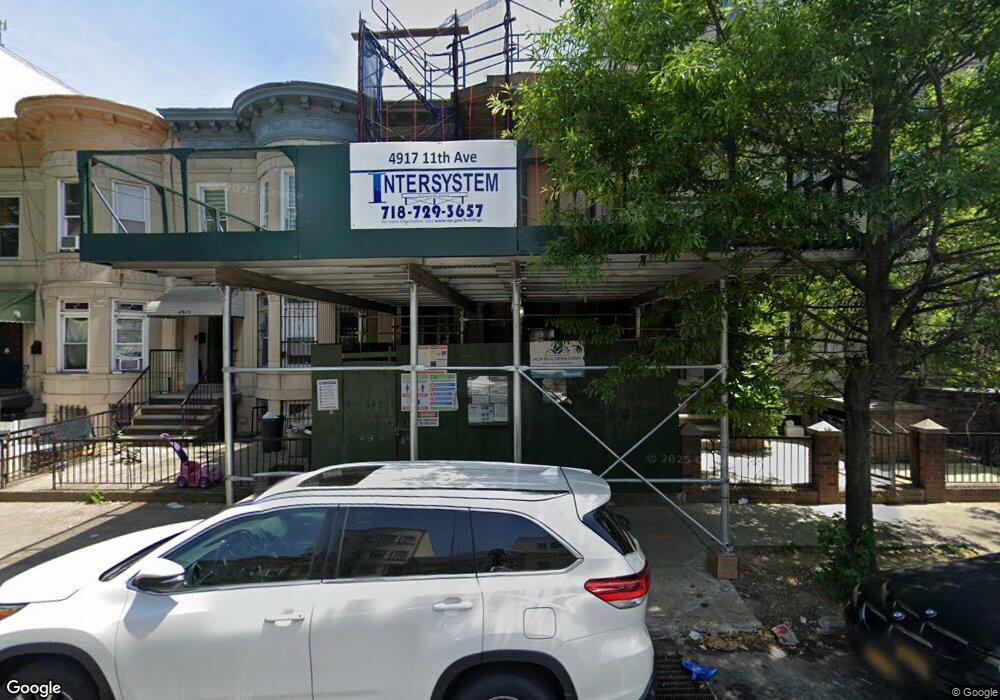
4919 11th Ave Brooklyn, NY 11219
Borough Park NeighborhoodEstimated Value: $1,907,000 - $2,742,023
Studio
--
Bath
4,400
Sq Ft
$495/Sq Ft
Est. Value
About This Home
This home is located at 4919 11th Ave, Brooklyn, NY 11219 and is currently estimated at $2,178,756, approximately $495 per square foot. 4919 11th Ave is a home located in Kings County with nearby schools including P.S. 164 Caesar Rodney School, IS 220 John J. Pershing, and Franklin Delano Roosevelt High School.
Ownership History
Date
Name
Owned For
Owner Type
Purchase Details
Closed on
Sep 30, 2024
Sold by
Barminka Rivka and Berger Toby
Bought by
Bierman Chanie
Current Estimated Value
Purchase Details
Closed on
Sep 25, 2024
Sold by
Chanie Bierman As Co- Administrator and Estate Of Abraham Bierman
Bought by
Barminka Rivka and Berger Toby
Purchase Details
Closed on
Oct 2, 2007
Sold by
Congregation Kehal Keren Ledovid
Bought by
Bierman Abraham
Home Financials for this Owner
Home Financials are based on the most recent Mortgage that was taken out on this home.
Original Mortgage
$665,000
Interest Rate
6.51%
Mortgage Type
Purchase Money Mortgage
Purchase Details
Closed on
Dec 18, 2000
Sold by
Rapaport Leah
Bought by
Congregation Kehal Keren Ledovid
Create a Home Valuation Report for This Property
The Home Valuation Report is an in-depth analysis detailing your home's value as well as a comparison with similar homes in the area
Home Values in the Area
Average Home Value in this Area
Purchase History
| Date | Buyer | Sale Price | Title Company |
|---|---|---|---|
| Bierman Chanie | -- | -- | |
| Bierman Chanie | -- | -- | |
| Barminka Rivka | -- | -- | |
| Barminka Rivka | -- | -- | |
| Bierman Abraham | $950,000 | -- | |
| Bierman Abraham | $950,000 | -- | |
| Congregation Kehal Keren Ledovid | $400,000 | Fidelity National Title Ins | |
| Congregation Kehal Keren Ledovid | $400,000 | Fidelity National Title Ins | |
| Rapaport Leah | -- | Fidelity National Title Ins | |
| Rapaport Leah | -- | Fidelity National Title Ins |
Source: Public Records
Mortgage History
| Date | Status | Borrower | Loan Amount |
|---|---|---|---|
| Previous Owner | Bierman Abraham | $665,000 |
Source: Public Records
Tax History
| Year | Tax Paid | Tax Assessment Tax Assessment Total Assessment is a certain percentage of the fair market value that is determined by local assessors to be the total taxable value of land and additions on the property. | Land | Improvement |
|---|---|---|---|---|
| 2025 | $9,602 | $132,240 | $38,820 | $93,420 |
| 2024 | $9,602 | $124,980 | $38,820 | $86,160 |
| 2023 | $9,159 | $153,360 | $38,820 | $114,540 |
| 2022 | $8,494 | $168,000 | $38,820 | $129,180 |
| 2021 | $8,954 | $131,520 | $38,820 | $92,700 |
| 2020 | $4,401 | $128,220 | $38,820 | $89,400 |
| 2019 | $8,376 | $103,740 | $38,820 | $64,920 |
| 2018 | $7,796 | $38,246 | $14,916 | $23,330 |
| 2017 | $6,208 | $30,456 | $14,400 | $16,056 |
| 2016 | $6,088 | $30,456 | $15,378 | $15,078 |
| 2015 | $3,465 | $30,057 | $19,057 | $11,000 |
| 2014 | $3,465 | $28,365 | $16,930 | $11,435 |
Source: Public Records
Map
Nearby Homes
- 4824 New Utrecht Ave
- 4726 New Utrecht Ave
- 4906 Fort Hamilton Pkwy
- 5209 Fort Hamilton Pkwy
- 5021 10th Ave
- 983 52nd St
- 972 52nd St
- 4518 11th Ave
- 1025 45th St Unit 1D
- 1025 45th St Unit 3F
- 959 55th St
- 945 55th St
- 911 48th St
- 871 52nd St
- 1323 46th St Unit 5C
- 1127 43rd St
- 1012 57th St
- 944 56th St
- 855 53rd St
- 845 51st St
- 4917 11th Ave
- 4921 11th Ave Unit 2
- 4921 11th Ave Unit 1
- 4921 11th Ave
- 4915 11th Ave
- 4911 11th Ave
- 1113 50th St
- 4909 11th Ave
- 1115 50th St
- 4907 11th Ave
- 5001 11th Ave Unit 4
- 5001 11th Ave Unit 3
- 5001 11th Ave Unit 2
- 5001 11th Ave Unit 1
- 5001 11th Ave
- 1117 50th St
- 4905 11th Ave
- 5003 11th Ave Unit 4
- 5003 11th Ave Unit 3
- 5003 11th Ave Unit 2
Your Personal Tour Guide
Ask me questions while you tour the home.