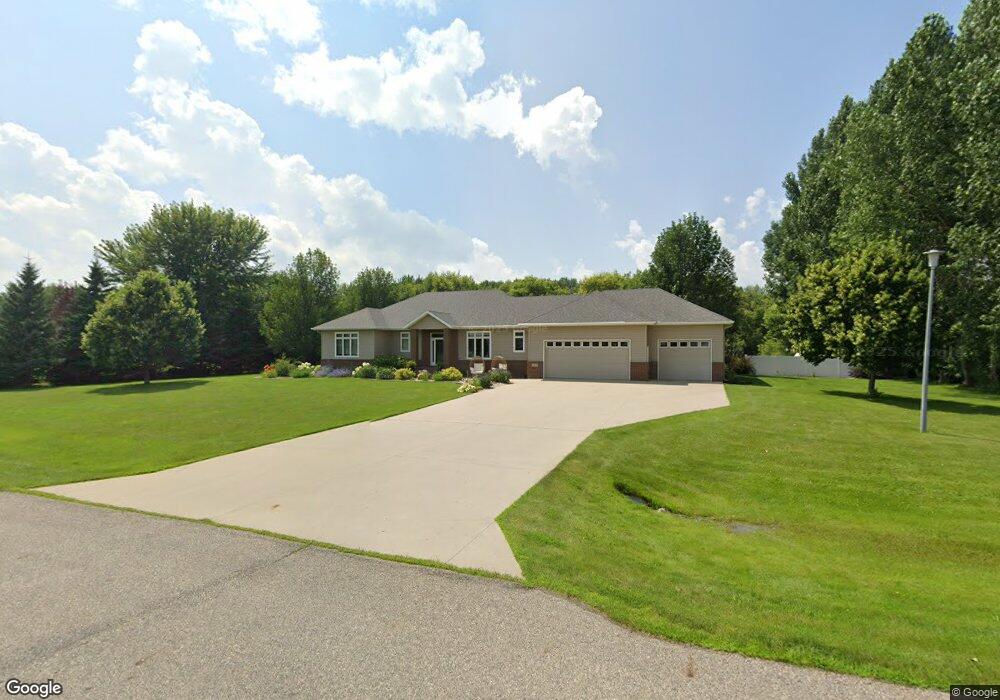
4919 2nd St E West Fargo, ND 58078
McMahon Estates NeighborhoodEstimated Value: $608,000 - $738,145
5
Beds
3
Baths
2,156
Sq Ft
$312/Sq Ft
Est. Value
About This Home
This home is located at 4919 2nd St E, West Fargo, ND 58078 and is currently estimated at $673,073, approximately $312 per square foot. 4919 2nd St E is a home located in Cass County with nearby schools including Liberty Middle School and West Fargo Sheyenne High School.
Ownership History
Date
Name
Owned For
Owner Type
Purchase Details
Closed on
Sep 21, 2018
Sold by
Jacobson David A and Jacobson Patricia
Bought by
Wambach Thomas and Wambach Angela
Current Estimated Value
Home Financials for this Owner
Home Financials are based on the most recent Mortgage that was taken out on this home.
Original Mortgage
$396,000
Outstanding Balance
$341,751
Interest Rate
4.5%
Mortgage Type
New Conventional
Estimated Equity
$331,322
Purchase Details
Closed on
Jul 27, 2007
Sold by
Albright Marshal and Albright Andrea
Bought by
Jacobson David A and Jacobson Patricia
Home Financials for this Owner
Home Financials are based on the most recent Mortgage that was taken out on this home.
Original Mortgage
$328,000
Interest Rate
6.76%
Mortgage Type
New Conventional
Create a Home Valuation Report for This Property
The Home Valuation Report is an in-depth analysis detailing your home's value as well as a comparison with similar homes in the area
Home Values in the Area
Average Home Value in this Area
Purchase History
| Date | Buyer | Sale Price | Title Company |
|---|---|---|---|
| Wambach Thomas | $495,000 | Title Co | |
| Jacobson David A | -- | -- |
Source: Public Records
Mortgage History
| Date | Status | Borrower | Loan Amount |
|---|---|---|---|
| Open | Wambach Thomas | $396,000 | |
| Previous Owner | Jacobson David A | $328,000 |
Source: Public Records
Tax History
| Year | Tax Paid | Tax Assessment Tax Assessment Total Assessment is a certain percentage of the fair market value that is determined by local assessors to be the total taxable value of land and additions on the property. | Land | Improvement |
|---|---|---|---|---|
| 2024 | $8,964 | $344,750 | $77,900 | $266,850 |
| 2023 | $8,816 | $319,850 | $60,400 | $259,450 |
| 2022 | $8,428 | $298,650 | $60,400 | $238,250 |
| 2021 | $8,232 | $268,100 | $38,700 | $229,400 |
| 2020 | $8,581 | $252,950 | $38,700 | $214,250 |
| 2019 | $8,502 | $244,950 | $38,700 | $206,250 |
| 2018 | $8,538 | $251,600 | $38,700 | $212,900 |
| 2017 | $8,377 | $250,550 | $38,700 | $211,850 |
| 2016 | $7,940 | $259,550 | $38,700 | $220,850 |
| 2015 | $7,472 | $220,300 | $37,950 | $182,350 |
| 2014 | $7,466 | $205,900 | $37,950 | $167,950 |
| 2013 | $7,430 | $198,750 | $37,950 | $160,800 |
Source: Public Records
Map
Nearby Homes
- 131 49th Ave E
- 106 50th Ave E
- 6152 Wildflower Dr
- 6090 Wildflower Dr S
- 4355 66th St S
- 5861 Wildflower Dr S
- 6562 56th Ave S
- 4727 6th St W
- 4615 Beach Ln S Unit 2B
- 4195 Furnberg Place S
- 662 Rania Way W
- 5460 11th St W
- 6511 Osgood Pkwy S
- 5179 Mira Way W
- 6204 56th Ave S
- 819 Rania Way W
- 8479 61st St S
- 8382 61st St S
- 8422 61st St S
- 8367 61st St S
Your Personal Tour Guide
Ask me questions while you tour the home.