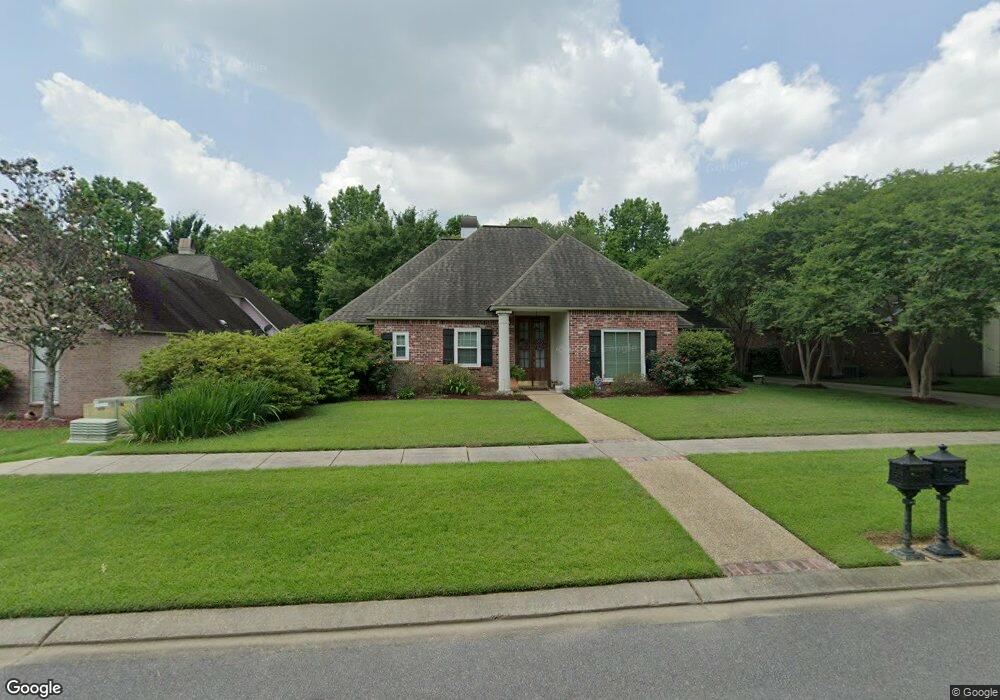
4919 Albert East Blvd Zachary, LA 70791
Estimated Value: $304,000 - $345,000
4
Beds
2
Baths
2,108
Sq Ft
$158/Sq Ft
Est. Value
About This Home
This home is located at 4919 Albert East Blvd, Zachary, LA 70791 and is currently estimated at $333,555, approximately $158 per square foot. 4919 Albert East Blvd is a home located in East Baton Rouge Parish with nearby schools including Rollins Place Elementary School, Zachary Elementary School, and Northwestern Middle School.
Ownership History
Date
Name
Owned For
Owner Type
Purchase Details
Closed on
Jun 10, 2025
Sold by
Brian Simmons Rodney and Lafleur Judy
Bought by
Buzbee Susan Marie and Buzbee John M
Current Estimated Value
Home Financials for this Owner
Home Financials are based on the most recent Mortgage that was taken out on this home.
Original Mortgage
$270,000
Outstanding Balance
$269,307
Interest Rate
6.81%
Mortgage Type
New Conventional
Estimated Equity
$64,248
Purchase Details
Closed on
Feb 11, 2011
Sold by
Gunter Robert E
Bought by
Simmons Rodney B
Home Financials for this Owner
Home Financials are based on the most recent Mortgage that was taken out on this home.
Original Mortgage
$243,662
Interest Rate
4.86%
Mortgage Type
FHA
Purchase Details
Closed on
Sep 25, 2008
Sold by
Perilloux Brannon C
Bought by
Gunter Robert E
Home Financials for this Owner
Home Financials are based on the most recent Mortgage that was taken out on this home.
Original Mortgage
$227,361
Interest Rate
6.57%
Mortgage Type
FHA
Purchase Details
Closed on
Jun 22, 1998
Sold by
Perilloux Brannon Charles
Bought by
Perilloux Alicia Coote
Home Financials for this Owner
Home Financials are based on the most recent Mortgage that was taken out on this home.
Original Mortgage
$160,000
Interest Rate
7.37%
Mortgage Type
Purchase Money Mortgage
Create a Home Valuation Report for This Property
The Home Valuation Report is an in-depth analysis detailing your home's value as well as a comparison with similar homes in the area
Home Values in the Area
Average Home Value in this Area
Purchase History
| Date | Buyer | Sale Price | Title Company |
|---|---|---|---|
| Buzbee Susan Marie | $345,000 | None Listed On Document | |
| Buzbee Susan Marie | $345,000 | None Listed On Document | |
| Simmons Rodney B | $250,000 | -- | |
| Gunter Robert E | $231,500 | -- | |
| Perilloux Alicia Coote | -- | -- | |
| Perilloux Brannon Charles | $160,000 | -- |
Source: Public Records
Mortgage History
| Date | Status | Borrower | Loan Amount |
|---|---|---|---|
| Open | Buzbee Susan Marie | $270,000 | |
| Closed | Buzbee Susan Marie | $270,000 | |
| Previous Owner | Simmons Rodney B | $243,662 | |
| Previous Owner | Gunter Robert E | $227,361 | |
| Previous Owner | Perilloux Brannon Charles | $160,000 |
Source: Public Records
Tax History Compared to Growth
Tax History
| Year | Tax Paid | Tax Assessment Tax Assessment Total Assessment is a certain percentage of the fair market value that is determined by local assessors to be the total taxable value of land and additions on the property. | Land | Improvement |
|---|---|---|---|---|
| 2024 | $2,756 | $28,910 | $2,600 | $26,310 |
| 2023 | $2,756 | $25,000 | $2,600 | $22,400 |
| 2022 | $3,135 | $25,000 | $2,600 | $22,400 |
| 2021 | $3,135 | $25,000 | $2,600 | $22,400 |
| 2020 | $3,164 | $25,000 | $2,600 | $22,400 |
| 2019 | $3,481 | $25,000 | $2,600 | $22,400 |
| 2018 | $3,494 | $25,000 | $2,600 | $22,400 |
| 2017 | $3,494 | $25,000 | $2,600 | $22,400 |
| 2016 | $2,435 | $25,000 | $2,600 | $22,400 |
| 2015 | $2,377 | $25,000 | $2,600 | $22,400 |
| 2014 | $2,369 | $25,000 | $2,600 | $22,400 |
| 2013 | -- | $25,000 | $2,600 | $22,400 |
Source: Public Records
Map
Nearby Homes
- 3679 E Meadow Ct
- 3620 Church St
- 5158 Myrtle Hill Ave
- 4608 40th St
- 2963 Church St
- 2853 April St
- 4286 39th St
- 4076 Bennett St
- 3504 Barnview Dr
- N-2-B Milldale Rd
- N-2-A Milldale Rd
- 4370 Honeysuckle Dr
- 2668 Dogwood Ln
- 0 E Flonacher Rd
- TBD Main St
- 3936 Hancock St
- 3952 Chestnut St
- 4179 Wilderness Run Dr
- 150 Prestwick Ct
- 4133 Chestnut St
- 4885 Albert East Blvd
- 2182 E Meadow Ct
- 2236 E Meadow Ct
- 2233 E Meadow Ct
- 2241 E Meadow Ct
- 2249 E Meadow Ct
- 4907 Albert East Blvd
- 4907 Albert Blvd E
- 4885 Albert Blvd E
- 4863 Albert East Blvd
- 4896 Albert East Blvd
- 4896 Albert Blvd E
- 4863 Albert Blvd E
- 4928 Albert East Blvd
- 4874 Albert East Blvd
- 4874 Albert Blvd E
- 4928 Albert Blvd E
- 4951 Albert East Blvd
- 4951 Albert Blvd E
- 4950 Albert East Blvd