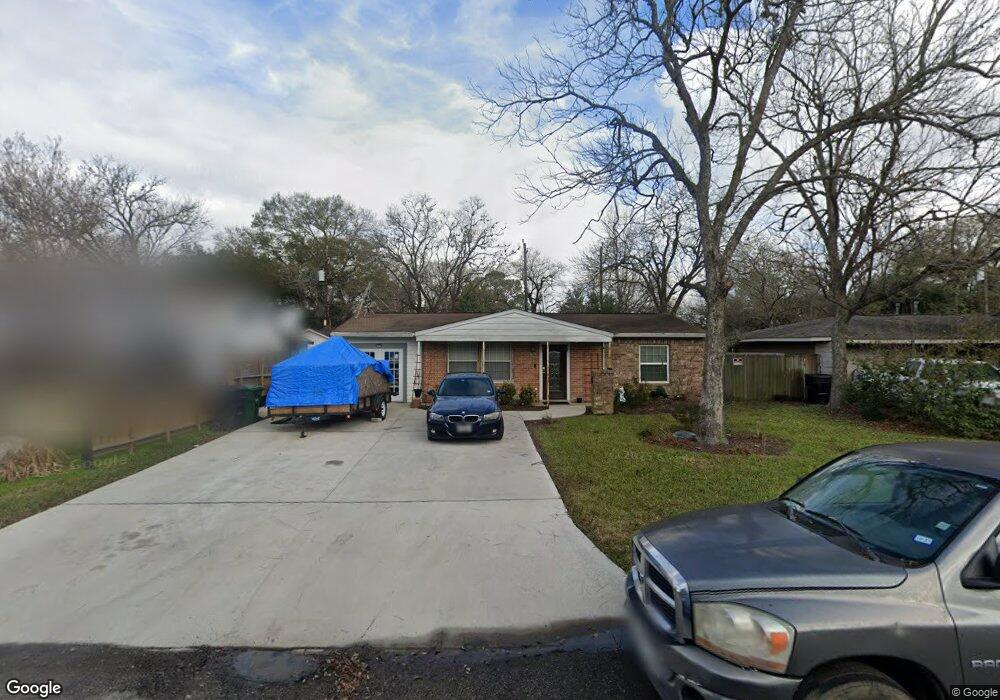
4919 Culmore Dr Houston, TX 77021
OST-South Union NeighborhoodEstimated Value: $155,245 - $246,000
2
Beds
1
Bath
1,008
Sq Ft
$198/Sq Ft
Est. Value
About This Home
This home is located at 4919 Culmore Dr, Houston, TX 77021 and is currently estimated at $199,311, approximately $197 per square foot. 4919 Culmore Dr is a home located in Harris County with nearby schools including Peck Elementary School, Cullen Middle School, and Yates High School.
Ownership History
Date
Name
Owned For
Owner Type
Purchase Details
Closed on
Jul 17, 2018
Sold by
Malvo Cassandra
Bought by
Calvin Dorothy
Current Estimated Value
Purchase Details
Closed on
Jun 30, 2016
Sold by
Malvo Dorothy
Bought by
Malvo Cassandra
Purchase Details
Closed on
Jul 31, 2002
Sold by
Wainwright Golda Swank
Bought by
Calvin Dorothy M
Home Financials for this Owner
Home Financials are based on the most recent Mortgage that was taken out on this home.
Original Mortgage
$45,103
Interest Rate
6.62%
Mortgage Type
FHA
Purchase Details
Closed on
Jul 29, 2002
Sold by
Kendall Gaye Ann Wainwright
Bought by
Wainwright Golda G
Home Financials for this Owner
Home Financials are based on the most recent Mortgage that was taken out on this home.
Original Mortgage
$45,103
Interest Rate
6.62%
Mortgage Type
FHA
Create a Home Valuation Report for This Property
The Home Valuation Report is an in-depth analysis detailing your home's value as well as a comparison with similar homes in the area
Home Values in the Area
Average Home Value in this Area
Purchase History
| Date | Buyer | Sale Price | Title Company |
|---|---|---|---|
| Calvin Dorothy | -- | None Available | |
| Malvo Cassandra | -- | None Available | |
| Calvin Dorothy M | -- | Texas American Title Company | |
| Wainwright Golda G | -- | Texas American Title Company |
Source: Public Records
Mortgage History
| Date | Status | Borrower | Loan Amount |
|---|---|---|---|
| Previous Owner | Calvin Dorothy M | $45,103 |
Source: Public Records
Tax History Compared to Growth
Tax History
| Year | Tax Paid | Tax Assessment Tax Assessment Total Assessment is a certain percentage of the fair market value that is determined by local assessors to be the total taxable value of land and additions on the property. | Land | Improvement |
|---|---|---|---|---|
| 2025 | $2,160 | $163,615 | $127,800 | $35,815 |
| 2024 | $2,160 | $159,135 | $127,800 | $31,335 |
| 2023 | $2,160 | $161,482 | $127,800 | $33,682 |
| 2022 | $2,635 | $155,284 | $113,600 | $41,684 |
| 2021 | $2,410 | $124,208 | $99,400 | $24,808 |
| 2020 | $2,393 | $94,342 | $71,000 | $23,342 |
| 2019 | $2,261 | $85,461 | $63,900 | $21,561 |
| 2018 | $1,215 | $79,402 | $55,025 | $24,377 |
| 2017 | $1,792 | $67,784 | $42,600 | $25,184 |
| 2016 | $1,417 | $53,584 | $28,400 | $25,184 |
| 2015 | $1,148 | $45,519 | $28,400 | $17,119 |
| 2014 | $1,148 | $44,677 | $28,400 | $16,277 |
Source: Public Records
Map
Nearby Homes
- 4930 Culmore Dr
- 4918 Culmore Dr
- 4826 Ventura Ln
- 4914 Gammage St
- 4838 Marietta Ln
- 5610 Milart St
- 4850 Marietta Ln
- 4902 Marietta Ln
- 4826 Culmore Dr
- 4910 Eppes St
- 4735 Marietta Ln
- 5706 Milart St
- 4807 Eppes St
- 5314 Dezirae Ln
- 5002 Elizabeth City St
- 5004 Elizabeth City St
- 4711 Marietta Ln
- 5003 Yesenia Palm St
- 5009 Elizabeth City St
- 5026 Marietta Ln
- 4915 Culmore Dr
- 4923 Culmore Dr
- 4911 Culmore Dr
- 4927 Culmore Dr
- 4814 Ventura Ln
- 4818 Ventura Ln
- 4931 Culmore Dr
- 4907 Culmore Dr
- 4922 Culmore Dr
- 4914 Culmore Dr
- 4822 Ventura Ln
- 4926 Culmore Dr
- 4810 Ventura Ln
- 5519 Grace Ln
- 4910 Culmore Dr
- 4935 Culmore Dr
- 4903 Culmore Dr
- 5515 Grace Ln
- 4915 Gammage St
- 4911 Gammage St