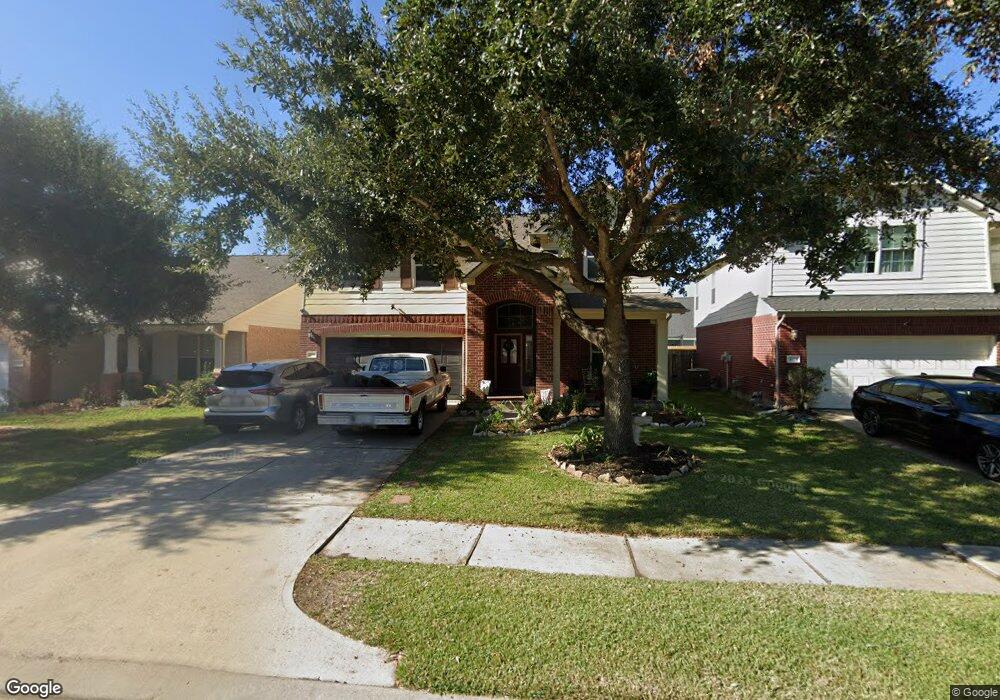
4919 Dwarf Honey Suckle Ct Houston, TX 77084
Grand Oaks NeighborhoodEstimated Value: $334,062 - $366,000
4
Beds
3
Baths
3,026
Sq Ft
$114/Sq Ft
Est. Value
About This Home
This home is located at 4919 Dwarf Honey Suckle Ct, Houston, TX 77084 and is currently estimated at $344,016, approximately $113 per square foot. 4919 Dwarf Honey Suckle Ct is a home located in Harris County with nearby schools including Sheridan Elementary School, Watkins Middle School, and Cypress Lakes High School.
Ownership History
Date
Name
Owned For
Owner Type
Purchase Details
Closed on
Jun 21, 2017
Sold by
Odutola Tayo A and Amao Lola A
Bought by
Santiago Roberto and Santiago Maria Salome
Current Estimated Value
Home Financials for this Owner
Home Financials are based on the most recent Mortgage that was taken out on this home.
Original Mortgage
$152,200
Outstanding Balance
$126,703
Interest Rate
4.05%
Mortgage Type
New Conventional
Estimated Equity
$217,313
Purchase Details
Closed on
Jan 23, 2007
Sold by
Terramark Homes Ltd
Bought by
Odutola Tayo A
Home Financials for this Owner
Home Financials are based on the most recent Mortgage that was taken out on this home.
Original Mortgage
$171,640
Interest Rate
6.19%
Mortgage Type
Purchase Money Mortgage
Create a Home Valuation Report for This Property
The Home Valuation Report is an in-depth analysis detailing your home's value as well as a comparison with similar homes in the area
Home Values in the Area
Average Home Value in this Area
Purchase History
| Date | Buyer | Sale Price | Title Company |
|---|---|---|---|
| Santiago Roberto | -- | Stewart Title Houston Div | |
| Odutola Tayo A | -- | Stewart Title Fort Bend Div |
Source: Public Records
Mortgage History
| Date | Status | Borrower | Loan Amount |
|---|---|---|---|
| Open | Santiago Roberto | $152,200 | |
| Previous Owner | Odutola Tayo A | $171,640 |
Source: Public Records
Tax History Compared to Growth
Tax History
| Year | Tax Paid | Tax Assessment Tax Assessment Total Assessment is a certain percentage of the fair market value that is determined by local assessors to be the total taxable value of land and additions on the property. | Land | Improvement |
|---|---|---|---|---|
| 2025 | $5,966 | $356,932 | $55,801 | $301,131 |
| 2024 | $5,966 | $347,190 | $55,801 | $291,389 |
| 2023 | $5,966 | $369,112 | $55,801 | $313,311 |
| 2022 | $7,505 | $331,634 | $50,677 | $280,957 |
| 2021 | $7,172 | $262,611 | $42,136 | $220,475 |
| 2020 | $7,060 | $248,571 | $30,178 | $218,393 |
| 2019 | $6,601 | $238,972 | $27,047 | $211,925 |
| 2018 | $1,995 | $204,417 | $20,783 | $183,634 |
| 2017 | $6,166 | $204,417 | $20,783 | $183,634 |
| 2016 | $6,166 | $204,417 | $20,783 | $183,634 |
| 2015 | $4,899 | $197,559 | $20,783 | $176,776 |
| 2014 | $4,899 | $189,214 | $20,783 | $168,431 |
Source: Public Records
Map
Nearby Homes
- 4907 Trailing Clover Ct
- 4926 Trailing Clover Ct
- 4807 Elm View Cir
- 5003 Forest Moss Ct
- 5011 Forest Moss Ct
- 4818 Twisting Rd
- 18926 Gentle Cove Ct
- 4714 Country Spring Rd
- 19203 Indian Stone Ln
- 4630 Twisting Rd
- 19215 Indian Stone Ln
- 18739 Appletree Ridge Rd
- 4506 Cypress Colony Ln
- 4607 Wild Bluebonnet Way
- 4611 Creek Bridge Ln
- 4607 Cobble Grove Ln
- 4807 Russet Trail Ct
- 4803 Plum Forest Rd
- 4815 Plum Forest Rd
- 3735 Rush Plains Ct
- 4915 Dwarf Honey Suckle Ct
- 4923 Dwarf Honey Suckle Ct
- 4911 Dwarf Honey Suckle Ct
- 4918 Trailing Clover Ct
- 4922 Trailing Clover Ct
- 4927 Dwarf Honey Suckle Ct
- 4914 Trailing Clover Ct
- 4910 Dwarf Honey Suckle Ct
- 4907 Dwarf Honeysuckle Ct
- 4907 Dwarf Honey Suckle Ct
- 4910 Trailing Clover Ct
- 4918 Dwarf Honey Suckle Ct
- 4914 Dwarf Honey Suckle Ct
- 4930 Trailing Clover Ct
- 4906 Trailing Clover Ct
- 19003 Windy Stone Dr
- 18931 Windy Stone Dr
- 4903 Dwarf Honeysuckle Ct
- 4910 Dwarf Honeysuckle Ct
- 4903 Dwarf Honey Suckle Ct