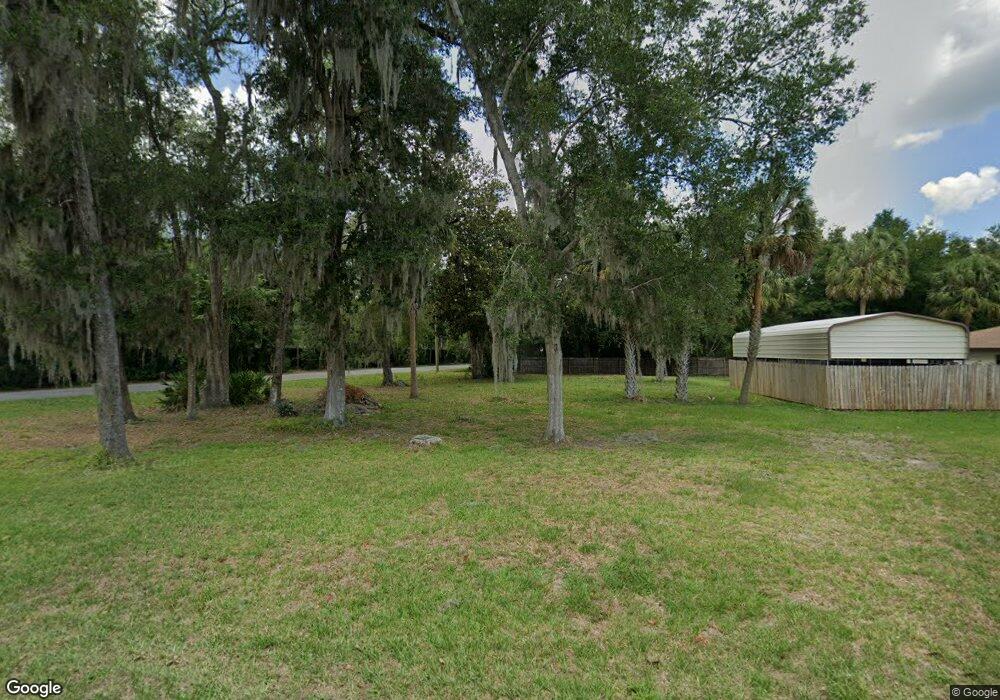
4919 E Parsons Point Rd Hernando, FL 34442
Estimated Value: $208,000 - $360,000
2
Beds
2
Baths
1,535
Sq Ft
$184/Sq Ft
Est. Value
About This Home
This home is located at 4919 E Parsons Point Rd, Hernando, FL 34442 and is currently estimated at $282,660, approximately $184 per square foot. 4919 E Parsons Point Rd is a home located in Citrus County with nearby schools including Hernando Elementary School, Citrus Springs Middle School, and Citrus High School.
Ownership History
Date
Name
Owned For
Owner Type
Purchase Details
Closed on
Feb 21, 2012
Sold by
Ashe Cecil W and Ashe Betty J
Bought by
Audry Verner M and Audry Mary M
Current Estimated Value
Purchase Details
Closed on
Aug 20, 2004
Sold by
Andry Vernon and Andry Mary
Bought by
Ashe Cecil W and Ashe Betty J
Home Financials for this Owner
Home Financials are based on the most recent Mortgage that was taken out on this home.
Original Mortgage
$92,720
Interest Rate
5.96%
Mortgage Type
Purchase Money Mortgage
Purchase Details
Closed on
Jul 3, 2002
Sold by
Mcdole Iris
Bought by
Andry Vernon and Andry Mary
Purchase Details
Closed on
Dec 17, 2001
Sold by
Centex Home Equity Company Llc
Bought by
Andry Verner and Andry Mary
Purchase Details
Closed on
Mar 22, 2001
Sold by
Light Wayne D and Light Maryann
Bought by
Centex Home Equity Corp
Create a Home Valuation Report for This Property
The Home Valuation Report is an in-depth analysis detailing your home's value as well as a comparison with similar homes in the area
Home Values in the Area
Average Home Value in this Area
Purchase History
| Date | Buyer | Sale Price | Title Company |
|---|---|---|---|
| Audry Verner M | $122,000 | Precision Title Suncoast Inc | |
| Ashe Cecil W | $115,900 | Citrus Land Title Llc | |
| Andry Vernon | $6,000 | American Title Svcs Of Citru | |
| Andry Verner | $65,000 | American Title Svcs Of Citru | |
| Centex Home Equity Corp | -- | -- | |
| Centex Home Equity Corp | -- | -- |
Source: Public Records
Mortgage History
| Date | Status | Borrower | Loan Amount |
|---|---|---|---|
| Previous Owner | Ashe Cecil W | $92,720 |
Source: Public Records
Tax History
| Year | Tax Paid | Tax Assessment Tax Assessment Total Assessment is a certain percentage of the fair market value that is determined by local assessors to be the total taxable value of land and additions on the property. | Land | Improvement |
|---|---|---|---|---|
| 2025 | $1,033 | $107,587 | -- | -- |
| 2024 | $997 | $104,555 | -- | -- |
| 2023 | $997 | $101,510 | $0 | $0 |
| 2022 | $989 | $98,553 | $0 | $0 |
| 2021 | $948 | $95,683 | $0 | $0 |
| 2020 | $897 | $135,767 | $11,810 | $123,957 |
| 2019 | $880 | $121,236 | $13,580 | $107,656 |
| 2018 | $849 | $99,084 | $13,580 | $85,504 |
| 2017 | $840 | $88,658 | $13,580 | $75,078 |
| 2016 | $843 | $86,834 | $13,580 | $73,254 |
| 2015 | $850 | $86,230 | $13,630 | $72,600 |
| 2014 | $921 | $89,000 | $13,660 | $75,340 |
Source: Public Records
Map
Nearby Homes
- 4920 E Parsons Point Rd
- 4836 E Fordham Place
- 2829 N Lakefront Dr
- 2778 N Rutgers Terrace
- 4801 E Yale Ln
- 3100 N Edwards Island
- 4523 E Harvard Dr
- 2580 N Bucknell Terrace
- 2763 N Vasser Terrace
- 2895 N Tomberlin Point
- 2562 N Lantern Terrace
- 3820 E Orange Dr
- 3708 E Fair Ct
- 2983 E Marcia St
- 800 N Sweet Gum Way
- 3990 N Bluewater Dr
- 4025 N Bluewater Dr
- 4480 E Van Ness Rd
- 3172 N Aquaview Terrace
- 4010 E Dandy Loop
- 4941 E Parsons Point Rd
- 4900 E Parsons Point Rd
- 4970 E Parsons Point Rd
- 4909 E Fordham Place
- 2915 N Lakefront Dr
- 4963 E Parsons Point Rd
- 4901 E Fordham Place
- 2905 N Lakefront Dr
- 4932 E Rugby Trail
- 2950 N Wheaton Point
- 4985 E Parsons Point Rd
- 4950 E Rugby Trail
- 2891 N Lakefront Dr
- 4875 E Fordham Place
- 3069 N Wheaton Point
- 4855 E Fordham Place
- 4859 E Rugby Trail
- 4923 E Rugby Trail
- 2860 N Lakefront Dr
Your Personal Tour Guide
Ask me questions while you tour the home.