Estimated Value: $458,000 - $510,000
5
Beds
3
Baths
2,776
Sq Ft
$173/Sq Ft
Est. Value
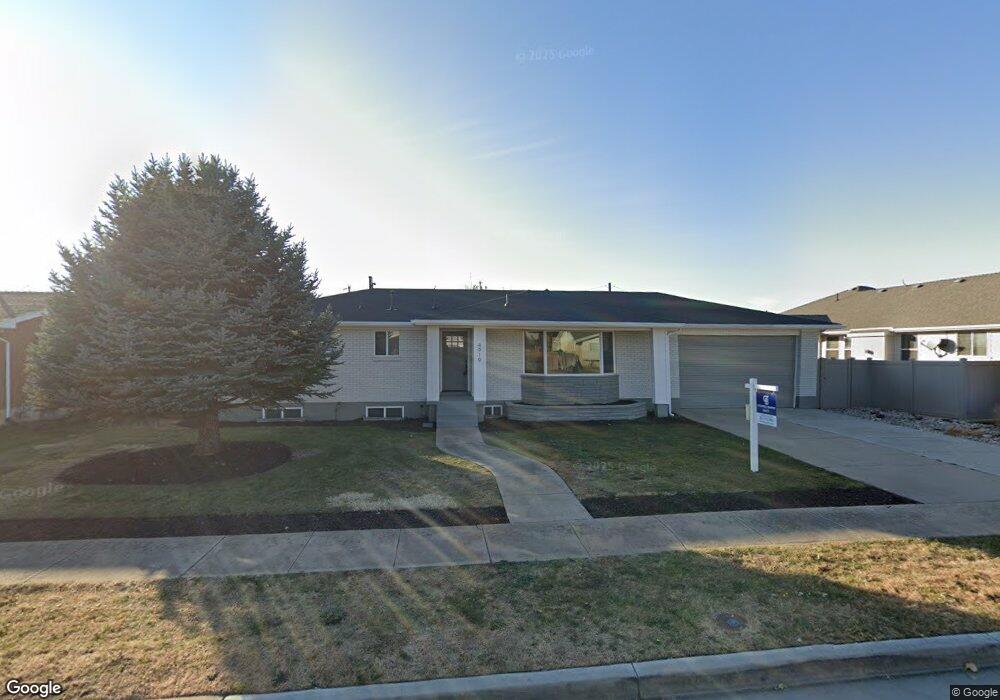
About This Home
This home is located at 4919 S 2275 W, Roy, UT 84067 and is currently estimated at $480,550, approximately $173 per square foot. 4919 S 2275 W is a home located in Weber County with nearby schools including Lakeview Elementary School, Roy Junior High School, and Roy High School.
Ownership History
Date
Name
Owned For
Owner Type
Purchase Details
Closed on
Jan 12, 2023
Sold by
Moreno Saul
Bought by
Moreno Saul and Jimenez Kathia
Current Estimated Value
Home Financials for this Owner
Home Financials are based on the most recent Mortgage that was taken out on this home.
Original Mortgage
$376,000
Outstanding Balance
$363,745
Interest Rate
6.31%
Mortgage Type
New Conventional
Estimated Equity
$116,805
Purchase Details
Closed on
May 11, 2022
Sold by
Budge Ross A
Bought by
Catamount Properties 2018 Llc
Purchase Details
Closed on
Aug 23, 2019
Sold by
Budge Allen N
Bought by
Budge Ross A
Purchase Details
Closed on
Dec 6, 2013
Sold by
Budge Allen N and Budge Melvalee
Bought by
The Allen And Melvalee Budge Family Trus and Budge Melvalee
Create a Home Valuation Report for This Property
The Home Valuation Report is an in-depth analysis detailing your home's value as well as a comparison with similar homes in the area
Home Values in the Area
Average Home Value in this Area
Purchase History
| Date | Buyer | Sale Price | Title Company |
|---|---|---|---|
| Moreno Saul | -- | None Listed On Document | |
| Catamount Properties 2018 Llc | -- | None Listed On Document | |
| Budge Ross A | -- | None Available | |
| The Allen And Melvalee Budge Family Trus | -- | None Available |
Source: Public Records
Mortgage History
| Date | Status | Borrower | Loan Amount |
|---|---|---|---|
| Open | Moreno Saul | $376,000 |
Source: Public Records
Tax History Compared to Growth
Tax History
| Year | Tax Paid | Tax Assessment Tax Assessment Total Assessment is a certain percentage of the fair market value that is determined by local assessors to be the total taxable value of land and additions on the property. | Land | Improvement |
|---|---|---|---|---|
| 2025 | $2,868 | $456,798 | $128,515 | $328,283 |
| 2024 | $2,720 | $239,249 | $70,683 | $168,566 |
| 2023 | $2,331 | $202,400 | $66,653 | $135,747 |
| 2022 | $2,708 | $447,000 | $110,201 | $336,799 |
| 2021 | $2,096 | $310,000 | $73,729 | $236,271 |
| 2020 | $1,946 | $264,000 | $73,729 | $190,271 |
| 2019 | $1,922 | $246,000 | $43,199 | $202,801 |
| 2018 | $1,760 | $211,000 | $39,930 | $171,070 |
| 2017 | $1,619 | $181,000 | $39,930 | $141,070 |
| 2016 | $1,595 | $96,191 | $19,926 | $76,265 |
| 2015 | $1,426 | $87,400 | $19,926 | $67,474 |
| 2014 | $1,431 | $86,942 | $17,039 | $69,903 |
Source: Public Records
Map
Nearby Homes