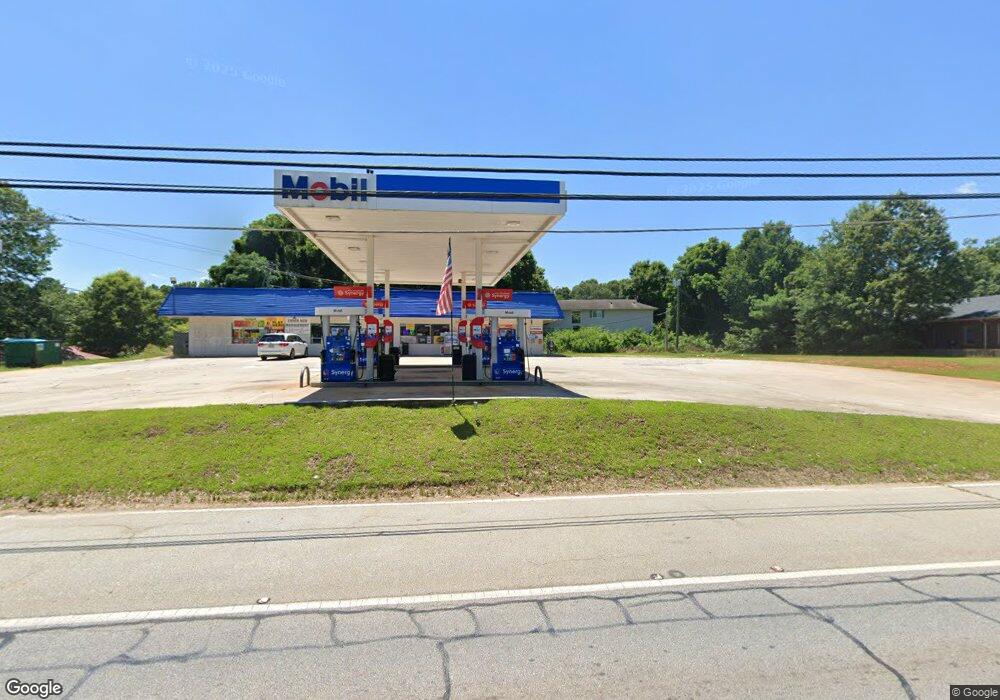
492 Athens St Jefferson, GA 30549
Estimated Value: $444,363
Studio
--
Bath
3,440
Sq Ft
$129/Sq Ft
Est. Value
About This Home
This home is located at 492 Athens St, Jefferson, GA 30549 and is currently estimated at $444,363, approximately $129 per square foot. 492 Athens St is a home located in Jackson County with nearby schools including Jefferson Elementary School, Jefferson Academy, and Jefferson Middle School.
Ownership History
Date
Name
Owned For
Owner Type
Purchase Details
Closed on
Oct 2, 2022
Sold by
Mazr Investment Inc
Bought by
Jefferson492 Llc
Current Estimated Value
Home Financials for this Owner
Home Financials are based on the most recent Mortgage that was taken out on this home.
Original Mortgage
$282,889
Interest Rate
6.48%
Mortgage Type
New Conventional
Purchase Details
Closed on
Dec 15, 2010
Sold by
Manocha S L
Bought by
Mazr Investment Inc
Home Financials for this Owner
Home Financials are based on the most recent Mortgage that was taken out on this home.
Original Mortgage
$350,000
Interest Rate
4.42%
Mortgage Type
Commercial
Purchase Details
Closed on
Nov 11, 2005
Sold by
Roy Aziz
Bought by
Vijai K K and Vijai Manocha S
Purchase Details
Closed on
Dec 5, 2002
Sold by
Manocha Vijai K and Manocha Sohan L
Bought by
Roy Aziz
Purchase Details
Closed on
Aug 6, 2002
Sold by
Chacko Thomas and Chacko Grac
Bought by
Manocha Vijai K and Manocha Sohan L
Create a Home Valuation Report for This Property
The Home Valuation Report is an in-depth analysis detailing your home's value as well as a comparison with similar homes in the area
Home Values in the Area
Average Home Value in this Area
Purchase History
| Date | Buyer | Sale Price | Title Company |
|---|---|---|---|
| Jefferson492 Llc | $425,000 | -- | |
| Mazr Investment Inc | $200,000 | -- | |
| Mazr Investment Inc | $200,000 | -- | |
| Vijai K K | -- | -- | |
| Manocha S L | -- | -- | |
| Vijai K K | $424,000 | -- | |
| Roy Aziz | $424,000 | -- | |
| Manocha Vijai K | $267,600 | -- |
Source: Public Records
Mortgage History
| Date | Status | Borrower | Loan Amount |
|---|---|---|---|
| Previous Owner | Jefferson492 Llc | $282,889 | |
| Previous Owner | Manocha S L | $350,000 |
Source: Public Records
Tax History
| Year | Tax Paid | Tax Assessment Tax Assessment Total Assessment is a certain percentage of the fair market value that is determined by local assessors to be the total taxable value of land and additions on the property. | Land | Improvement |
|---|---|---|---|---|
| 2025 | $4,650 | $169,400 | $59,880 | $109,520 |
| 2024 | $4,650 | $169,400 | $59,880 | $109,520 |
| 2023 | $4,669 | $170,240 | $59,880 | $110,360 |
| 2022 | $3,294 | $102,480 | $47,880 | $54,600 |
| 2021 | $3,850 | $117,640 | $47,880 | $69,760 |
| 2020 | $3,154 | $90,040 | $38,320 | $51,720 |
| 2019 | $3,202 | $90,040 | $38,320 | $51,720 |
| 2018 | $3,594 | $100,280 | $38,320 | $61,960 |
| 2017 | $3,668 | $100,308 | $38,333 | $61,975 |
| 2016 | $3,686 | $100,308 | $38,333 | $61,975 |
| 2015 | $3,504 | $94,975 | $33,000 | $61,975 |
| 2014 | $3,539 | $94,975 | $33,000 | $61,975 |
| 2013 | -- | $98,036 | $33,000 | $65,036 |
Source: Public Records
Map
Nearby Homes
- 143 Elrod Ave
- 131 Martin Luther King jr Dr
- 176 Crimson Feather Dr
- 225 Borders St
- 89 Fairlane Dr
- 336 Gordon St
- 61 Harris Ln
- 0 Curry Dr Unit LOT 30
- 0 Curry Dr Unit 7665673
- 0 Curry Dr Unit 7666260
- 0 Curry Dr Unit LOT 6
- 0 Curry Dr Unit LOT 14
- 0 Curry Dr Unit LOT 32
- 0 Curry Dr Unit 7665753
- 0 Curry Dr Unit LOT 31
- 0 Curry Dr Unit 7666653
- 0 Curry Dr Unit LOT 13
- 0 Curry Dr Unit LOT 35
- 0 Curry Dr Unit 7665736
- 0 Curry Dr Unit 7666371
- 2 Jefferson Terrace
- 2 Jefferson Terrace Unit 2
- 2 Jefferson Terrace
- 456 Athens St
- 7990 Jefferson Rd
- 0 the Heritage at Jefferson Subdivision Lots Unit CM922365
- 0 the Heritage at Jefferson Subdivision Lots Unit 4228539
- 0 the Heritage at Jefferson Unit 57 LOTS 3071005
- 7 Jefferson Terrace
- 834 Gordon St
- 840 Gordon St
- 840 Gordon St
- 00 Highway 82
- 422 Athens St
- 441 Athens St
- 21 Jefferson Terrace Unit B
- 21 Jefferson Terrace
- 21 Jefferson Terrace
- 21 Jefferson Terrace Unit B
- 21 Jefferson Terrace
Your Personal Tour Guide
Ask me questions while you tour the home.