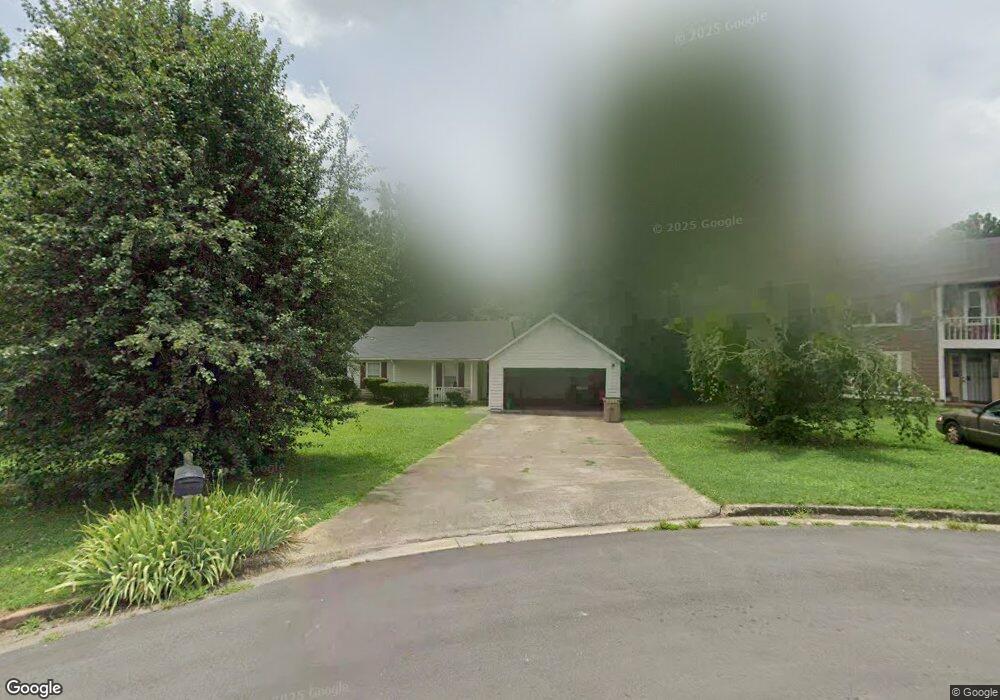
492 Camp Hill Ln Unit 1 Jonesboro, GA 30238
Estimated Value: $219,275 - $252,000
3
Beds
2
Baths
1,374
Sq Ft
$167/Sq Ft
Est. Value
About This Home
This home is located at 492 Camp Hill Ln Unit 1, Jonesboro, GA 30238 and is currently estimated at $229,319, approximately $166 per square foot. 492 Camp Hill Ln Unit 1 is a home located in Clayton County with nearby schools including Kemp Primary School, Kemp Elementary School, and Mundys Mill Middle School.
Ownership History
Date
Name
Owned For
Owner Type
Purchase Details
Closed on
Jun 30, 2011
Sold by
Federal Natl Mtg Assn Fnma
Bought by
Flaster Jacob
Current Estimated Value
Purchase Details
Closed on
Apr 5, 2011
Sold by
Jackson Tameeca
Bought by
Federal Natl Mtg Assn Fnma
Purchase Details
Closed on
May 12, 2003
Sold by
Hayes Javier S
Bought by
Jackson Tameeca
Home Financials for this Owner
Home Financials are based on the most recent Mortgage that was taken out on this home.
Original Mortgage
$102,696
Interest Rate
5.79%
Mortgage Type
FHA
Purchase Details
Closed on
Nov 18, 1996
Sold by
Hoffer Gilbert H
Bought by
Hayes Javier S
Purchase Details
Closed on
Sep 30, 1994
Sold by
Sapp Howard E Cynthia L
Bought by
Hoffer Gilbert H
Home Financials for this Owner
Home Financials are based on the most recent Mortgage that was taken out on this home.
Original Mortgage
$71,298
Interest Rate
8.5%
Mortgage Type
VA
Create a Home Valuation Report for This Property
The Home Valuation Report is an in-depth analysis detailing your home's value as well as a comparison with similar homes in the area
Home Values in the Area
Average Home Value in this Area
Purchase History
| Date | Buyer | Sale Price | Title Company |
|---|---|---|---|
| Flaster Jacob | -- | -- | |
| Federal Natl Mtg Assn Fnma | $92,098 | -- | |
| Jackson Tameeca | $103,700 | -- | |
| Hayes Javier S | $72,600 | -- | |
| Hoffer Gilbert H | $69,900 | -- |
Source: Public Records
Mortgage History
| Date | Status | Borrower | Loan Amount |
|---|---|---|---|
| Previous Owner | Jackson Tameeca | $102,696 | |
| Previous Owner | Hoffer Gilbert H | $71,298 | |
| Closed | Hayes Javier S | $0 |
Source: Public Records
Tax History Compared to Growth
Tax History
| Year | Tax Paid | Tax Assessment Tax Assessment Total Assessment is a certain percentage of the fair market value that is determined by local assessors to be the total taxable value of land and additions on the property. | Land | Improvement |
|---|---|---|---|---|
| 2024 | $3,267 | $82,840 | $7,200 | $75,640 |
| 2023 | $3,027 | $83,840 | $7,200 | $76,640 |
| 2022 | $0 | $67,440 | $7,200 | $60,240 |
| 2021 | $2,070 | $51,520 | $7,200 | $44,320 |
| 2020 | $1,906 | $46,785 | $7,200 | $39,585 |
| 2019 | $1,650 | $41,499 | $5,600 | $35,899 |
| 2018 | $1,650 | $39,789 | $5,600 | $34,189 |
| 2017 | $1,268 | $30,294 | $5,600 | $24,694 |
| 2016 | $1,280 | $30,588 | $5,600 | $24,988 |
| 2015 | $1,270 | $0 | $0 | $0 |
| 2014 | $1,045 | $25,387 | $5,600 | $19,787 |
Source: Public Records
Map
Nearby Homes
- 9556 Thomas Downs Ln Unit 1
- 9409 Forest Knoll Dr
- 9404 Cypress Ln
- 9383 Woodknoll Way Unit 4
- 301 Deerfield Dr
- 9404 Bogey Ct
- 255 Olde Oak Dr
- 9342 Thomas Rd
- 725 River Mist Dr
- 281 Willow Springs Dr
- 288 Country Club Dr
- 316 River Chase Dr
- 254 Country Club Dr
- 22 Fairview Dr
- 296 Country Club Dr
- 556 Country Greens Dr
- 299 Country Club Dr
- 237 Country Club Dr
- 226 Woodwind Way
- 251 River Chase Dr
- 484 Camp Hill Ln
- 496 Camp Hill Ln Unit 1
- 9555 Downs Ct
- 9563 Downs Ct
- 9539 Downs Ct
- 9529 Downs Ct
- 9563 Downs Ct
- 500 Camp Hill Ln Unit 1
- 552 Thomas Downs Way
- 485 Camp Hill Ln
- 9571 Downs Ct
- 477 Camp Hill Ln
- 499 Camp Hill Ln
- 9581 Downs Ct Unit 1
- 469 Camp Hill Ln Unit 1
- 556 Thomas Downs Way
- 454 Camp Hill Ln
- 542 Thomas Downs Way
- 9548 Downs Ct