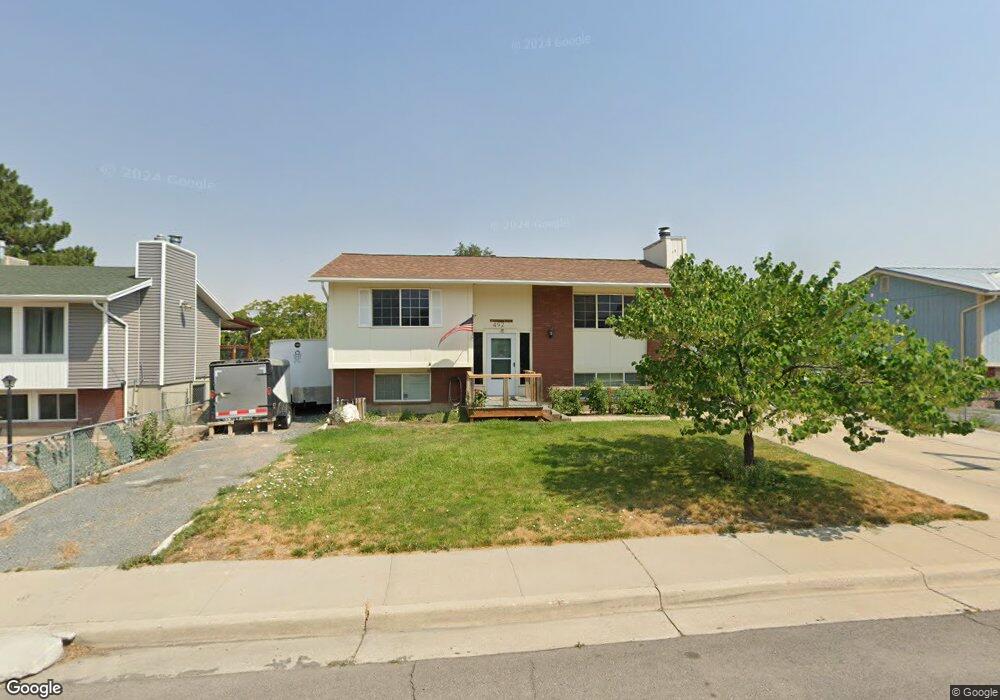
492 Havasu St Tooele, UT 84074
Estimated Value: $370,000 - $404,000
4
Beds
2
Baths
1,836
Sq Ft
$211/Sq Ft
Est. Value
About This Home
This home is located at 492 Havasu St, Tooele, UT 84074 and is currently estimated at $388,303, approximately $211 per square foot. 492 Havasu St is a home located in Tooele County with nearby schools including Northlake Elementary School, Tooele Junior High School, and Tooele High School.
Ownership History
Date
Name
Owned For
Owner Type
Purchase Details
Closed on
Aug 20, 2013
Sold by
Hammond Jenifer L
Bought by
Hammond Tracy E
Current Estimated Value
Home Financials for this Owner
Home Financials are based on the most recent Mortgage that was taken out on this home.
Original Mortgage
$133,658
Interest Rate
4.75%
Mortgage Type
FHA
Purchase Details
Closed on
Dec 12, 2006
Sold by
Hammond Tracy E and Hammond Jennifer L
Bought by
Hammond Tracey E and Hammond Jennifer L
Home Financials for this Owner
Home Financials are based on the most recent Mortgage that was taken out on this home.
Original Mortgage
$135,300
Interest Rate
6.32%
Mortgage Type
New Conventional
Create a Home Valuation Report for This Property
The Home Valuation Report is an in-depth analysis detailing your home's value as well as a comparison with similar homes in the area
Home Values in the Area
Average Home Value in this Area
Purchase History
| Date | Buyer | Sale Price | Title Company |
|---|---|---|---|
| Hammond Tracy E | -- | Metro National Title | |
| Hammond Tracey E | -- | Accommodation | |
| Hammond Tracy E | -- | Mt Olympus Title |
Source: Public Records
Mortgage History
| Date | Status | Borrower | Loan Amount |
|---|---|---|---|
| Closed | Hammond Tracy E | $133,658 | |
| Closed | Hammond Tracy E | $135,300 |
Source: Public Records
Tax History Compared to Growth
Tax History
| Year | Tax Paid | Tax Assessment Tax Assessment Total Assessment is a certain percentage of the fair market value that is determined by local assessors to be the total taxable value of land and additions on the property. | Land | Improvement |
|---|---|---|---|---|
| 2025 | $2,544 | $212,202 | $56,375 | $155,827 |
| 2024 | $2,797 | $213,469 | $56,375 | $157,094 |
| 2023 | $2,797 | $209,087 | $53,689 | $155,398 |
| 2022 | $2,423 | $208,473 | $67,155 | $141,318 |
| 2021 | $2,031 | $146,131 | $21,381 | $124,750 |
| 2020 | $1,919 | $239,599 | $38,875 | $200,724 |
| 2019 | $1,776 | $218,093 | $38,875 | $179,218 |
| 2018 | $1,540 | $179,348 | $30,000 | $149,348 |
| 2017 | $1,298 | $179,348 | $30,000 | $149,348 |
| 2016 | $933 | $76,562 | $15,125 | $61,437 |
| 2015 | $933 | $67,825 | $0 | $0 |
| 2014 | -- | $67,825 | $0 | $0 |
Source: Public Records
Map
Nearby Homes
- 416 N 340 W
- 541 N Coleman St
- 372 W 600 N Unit 42
- 614 N 640 W
- 605 N 640 W
- 362 W 600 N Unit 43
- 352 W 600 N Unit 44
- Snowbird Plan at Vista Meadows
- Sundance Plan at Vista Meadows
- Brighton Plan at Vista Meadows
- Solitude Plan at Vista Meadows
- 377 W 630 St N Unit 22
- 363 W 630 North St Unit 20
- 394 W 630 N Unit 8
- 745 W Mckellar St
- 353 W 630 N Unit 19
- 225 230 N
- 307 N 200 W
- 374 W 630 North St Unit 10
- 605 Kay Ln