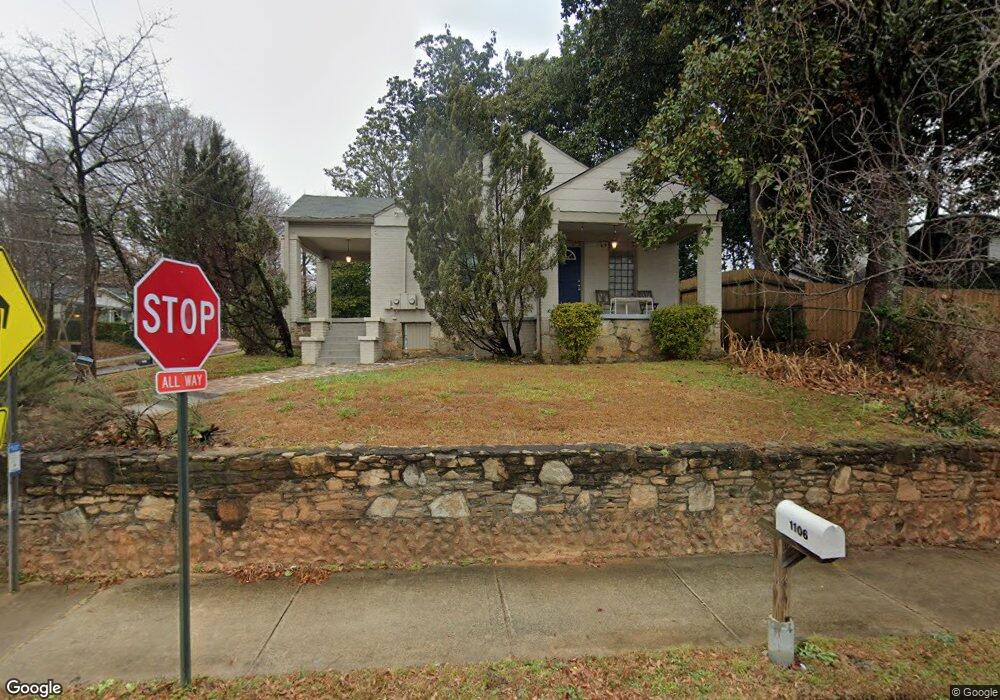
492 Hemlock Cir SE Atlanta, GA 30316
Ormewood Park NeighborhoodEstimated Value: $470,938 - $617,000
2
Beds
2
Baths
1,605
Sq Ft
$330/Sq Ft
Est. Value
About This Home
This home is located at 492 Hemlock Cir SE, Atlanta, GA 30316 and is currently estimated at $530,235, approximately $330 per square foot. 492 Hemlock Cir SE is a home located in Fulton County with nearby schools including Parkside Elementary School, King Middle School, and Maynard Holbrook Jackson High School.
Ownership History
Date
Name
Owned For
Owner Type
Purchase Details
Closed on
Oct 31, 2011
Sold by
Destin Title And Guaranty
Bought by
Bowen Lynda A
Current Estimated Value
Home Financials for this Owner
Home Financials are based on the most recent Mortgage that was taken out on this home.
Original Mortgage
$58,125
Outstanding Balance
$39,769
Interest Rate
4.09%
Mortgage Type
New Conventional
Estimated Equity
$490,466
Purchase Details
Closed on
May 23, 2005
Sold by
Belva P D
Bought by
Lee Tonia C
Home Financials for this Owner
Home Financials are based on the most recent Mortgage that was taken out on this home.
Original Mortgage
$146,400
Interest Rate
7.23%
Mortgage Type
New Conventional
Purchase Details
Closed on
Nov 30, 2000
Sold by
Relken Christopher H
Bought by
Belva P Danilla
Purchase Details
Closed on
Nov 11, 1996
Sold by
Moore Stephen N
Bought by
Relken Christopher
Create a Home Valuation Report for This Property
The Home Valuation Report is an in-depth analysis detailing your home's value as well as a comparison with similar homes in the area
Home Values in the Area
Average Home Value in this Area
Purchase History
| Date | Buyer | Sale Price | Title Company |
|---|---|---|---|
| Bowen Lynda A | $77,500 | -- | |
| Lee Tonia C | $183,000 | -- | |
| Belva P Danilla | $165,000 | -- | |
| Relken Christopher | $68,300 | -- |
Source: Public Records
Mortgage History
| Date | Status | Borrower | Loan Amount |
|---|---|---|---|
| Open | Bowen Lynda A | $58,125 | |
| Previous Owner | Lee Tonia C | $146,400 | |
| Closed | Relken Christopher | $0 |
Source: Public Records
Tax History Compared to Growth
Tax History
| Year | Tax Paid | Tax Assessment Tax Assessment Total Assessment is a certain percentage of the fair market value that is determined by local assessors to be the total taxable value of land and additions on the property. | Land | Improvement |
|---|---|---|---|---|
| 2025 | $5,104 | $239,680 | $56,080 | $183,600 |
| 2023 | $6,624 | $160,000 | $31,640 | $128,360 |
| 2022 | $4,533 | $160,000 | $31,640 | $128,360 |
| 2021 | $4,537 | $112,000 | $20,160 | $91,840 |
| 2020 | $4,588 | $112,000 | $20,160 | $91,840 |
| 2019 | $925 | $112,000 | $20,160 | $91,840 |
| 2018 | $5,384 | $130,040 | $19,680 | $110,360 |
| 2017 | $3,882 | $89,880 | $21,160 | $68,720 |
| 2016 | $3,892 | $89,880 | $21,160 | $68,720 |
| 2015 | $4,770 | $89,880 | $21,160 | $68,720 |
| 2014 | $3,508 | $77,360 | $18,200 | $59,160 |
Source: Public Records
Map
Nearby Homes
- 1142 Portland Ave SE
- 1129 Sanders Ave SE
- 1127 Portland Ave SE
- 1102 Sanders Ave SE
- 1064 Glenwood Ave SE
- 444 Lytle Ave SE
- 1058 Sanders Ave SE
- 1111 Moreland Place SE
- 1126 Village Ct SE
- 474 Glenwood Place SE
- 642 Woodland Ave SE
- 651 Moreland Ave SE
- 965 N Ormewood Park Dr SE
- 953 Faith Ave SE
- 1265 Wright Ln SE
- 1256 Mcpherson Ave SE
- 495 Hamilton St SE
- 1065 Berne St SE
- 956 Glenwood Park Dr SE
- 492 Hemlock Cir SE
- 1112 Glenwood Ave SE
- 482 Hemlock Cir SE
- 476 Hemlock Cir SE
- 485 Hemlock Cir SE
- 1118 Glenwood Ave SE
- 495 Hemlock Cir SE
- 481 Hemlock Cir SE
- 481 Hemlock Cir SE
- 472 Hemlock Cir SE
- 1105 Glenwood Ave SE
- 475 Hemlock Cir SE
- 477 Florida Ave SE
- 1107 Glenwood Ave SE
- 1093 Glenwood Ave SE
- 1113 Glenwood Ave SE
- 471 Hemlock Cir SE
- 466 Hemlock Cir SE
- 475 Florida Ave SE
- 1117 Glenwood Ave SE