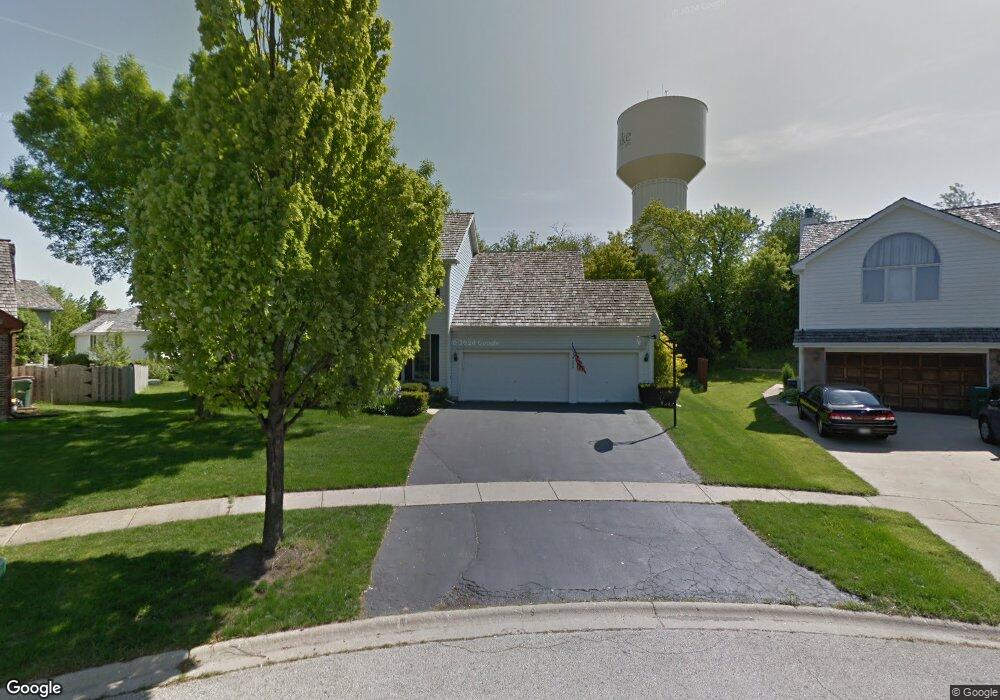
492 Iron Horse Ct Grayslake, IL 60030
Estimated Value: $470,542 - $514,000
5
Beds
3
Baths
2,758
Sq Ft
$178/Sq Ft
Est. Value
About This Home
This home is located at 492 Iron Horse Ct, Grayslake, IL 60030 and is currently estimated at $490,386, approximately $177 per square foot. 492 Iron Horse Ct is a home located in Lake County with nearby schools including Frederick School, Prairieview School, and Grayslake Middle School.
Ownership History
Date
Name
Owned For
Owner Type
Purchase Details
Closed on
May 22, 2009
Sold by
Dent James H and Dent Marsha A
Bought by
Moreno Kevin L and Martinelli Pasqua
Current Estimated Value
Home Financials for this Owner
Home Financials are based on the most recent Mortgage that was taken out on this home.
Original Mortgage
$279,812
Interest Rate
5.21%
Mortgage Type
FHA
Purchase Details
Closed on
May 13, 1999
Sold by
Wankowski David A and Wankowski Deborah J
Bought by
Dent James H and Dent Marsha A
Home Financials for this Owner
Home Financials are based on the most recent Mortgage that was taken out on this home.
Original Mortgage
$174,750
Interest Rate
7.54%
Purchase Details
Closed on
Jul 19, 1996
Sold by
Mazur Thomas and Mazur Sandra
Bought by
Wankowski David A and Wankowski Deborah J
Home Financials for this Owner
Home Financials are based on the most recent Mortgage that was taken out on this home.
Original Mortgage
$195,000
Interest Rate
8.27%
Mortgage Type
Balloon
Create a Home Valuation Report for This Property
The Home Valuation Report is an in-depth analysis detailing your home's value as well as a comparison with similar homes in the area
Home Values in the Area
Average Home Value in this Area
Purchase History
| Date | Buyer | Sale Price | Title Company |
|---|---|---|---|
| Moreno Kevin L | $285,000 | None Available | |
| Dent James H | $233,000 | -- | |
| Wankowski David A | $220,000 | First American Title |
Source: Public Records
Mortgage History
| Date | Status | Borrower | Loan Amount |
|---|---|---|---|
| Previous Owner | Moreno Kevin L | $279,812 | |
| Previous Owner | Dent James H | $174,750 | |
| Previous Owner | Wankowski David A | $195,000 |
Source: Public Records
Tax History Compared to Growth
Tax History
| Year | Tax Paid | Tax Assessment Tax Assessment Total Assessment is a certain percentage of the fair market value that is determined by local assessors to be the total taxable value of land and additions on the property. | Land | Improvement |
|---|---|---|---|---|
| 2024 | $13,391 | $132,791 | $19,895 | $112,896 |
| 2023 | $12,480 | $121,871 | $18,259 | $103,612 |
| 2022 | $12,480 | $110,075 | $15,138 | $94,937 |
| 2021 | $12,340 | $105,800 | $14,550 | $91,250 |
| 2020 | $12,344 | $100,666 | $13,844 | $86,822 |
| 2019 | $11,921 | $96,580 | $13,282 | $83,298 |
| 2018 | $11,755 | $95,909 | $16,103 | $79,806 |
| 2017 | $11,695 | $90,216 | $15,147 | $75,069 |
| 2016 | $11,232 | $83,279 | $13,982 | $69,297 |
| 2015 | $10,955 | $76,082 | $12,774 | $63,308 |
| 2014 | $10,212 | $71,049 | $13,146 | $57,903 |
| 2012 | $10,043 | $74,203 | $13,730 | $60,473 |
Source: Public Records
Map
Nearby Homes
- 390 N Garfield Blvd
- 10 Glen St
- 349 Brittain Ave
- 42 Village Station Ln
- 146 Westerfield Place
- 102 Soo Line Dr
- 533 Cannon Ball Dr
- 121 Park Ave
- 231 Lionel Dr
- 270 Lionel Dr
- 228 Station Park Cir
- 11 S Lake St
- 101 Burton St
- 220 Bluff Ct
- Lot 48 Lake Ave
- 32100 Alleghany Rd
- 34110 S Circle Dr
- 1617 Albany St
- 1191 Hummingbird Ln
- 26155 W Il Route 120
- 484 Iron Horse Ct
- 487 Iron Horse Ct
- 499 Wicks St
- 489 Wicks St
- 470 Iron Horse Ct
- 479 Iron Horse Ct
- 481 Wicks St
- 471 Iron Horse Ct
- 454 Iron Horse Ct
- 494 Signal Ln
- 473 Wicks St
- 463 Iron Horse Ct
- 427 Lincoln Ave
- 304 Jackson Blvd
- 446 Iron Horse Ct
- 498 Wicks St
- 490 Wicks St
- 463 Wicks St
- 478 Signal Ln
- 482 Wicks St