Estimated Value: $927,836 - $1,174,000
3
Beds
2
Baths
3,466
Sq Ft
$306/Sq Ft
Est. Value
About This Home
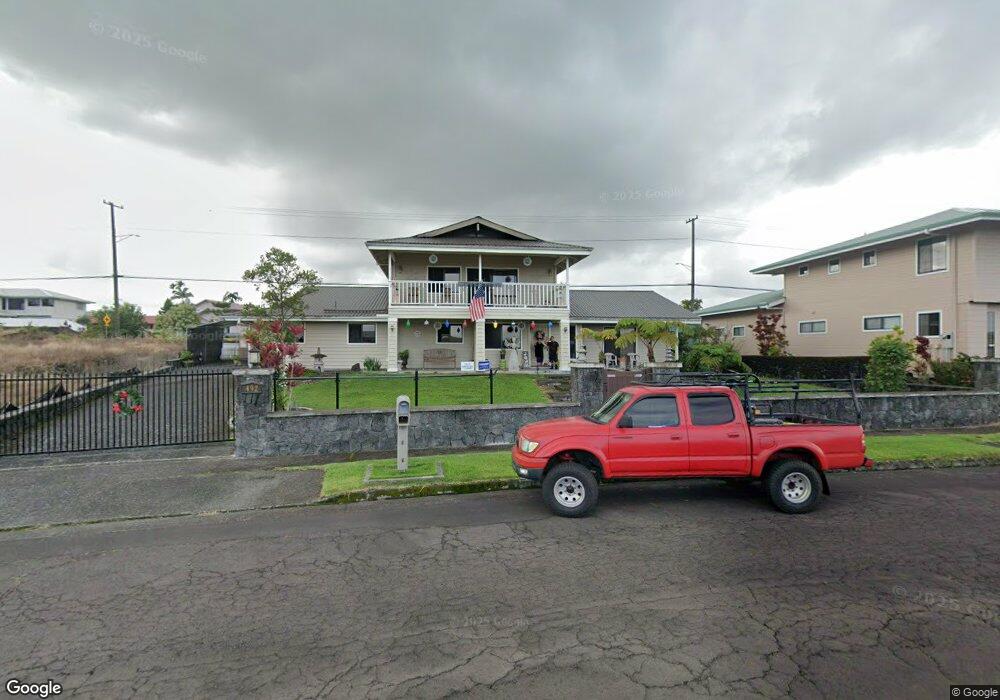
This home is located at 492 Kaanini St, Hilo, HI 96720 and is currently estimated at $1,060,709, approximately $306 per square foot. 492 Kaanini St is a home located in Hawaii County with nearby schools including Hilo Union Elementary School, Hilo Intermediate School, and Hilo High School.
Ownership History
Date
Name
Owned For
Owner Type
Purchase Details
Closed on
Aug 23, 2019
Sold by
Picar Zachary Dexter
Bought by
Picar Zachary Dexter and Picar Loriann Audrey
Current Estimated Value
Purchase Details
Closed on
Jul 31, 2007
Sold by
Rubio Ricardo Joseph and Rubio Karen Joy
Bought by
Picar Zachary Dexter
Home Financials for this Owner
Home Financials are based on the most recent Mortgage that was taken out on this home.
Original Mortgage
$592,500
Outstanding Balance
$388,618
Interest Rate
2.25%
Mortgage Type
Negative Amortization
Estimated Equity
$672,091
Purchase Details
Closed on
Jun 9, 2006
Sold by
Oconnell Judy Ann
Bought by
Rubio Ricardo Joseph and Rubio Karen Joy
Home Financials for this Owner
Home Financials are based on the most recent Mortgage that was taken out on this home.
Original Mortgage
$300,000
Interest Rate
6.55%
Mortgage Type
Purchase Money Mortgage
Create a Home Valuation Report for This Property
The Home Valuation Report is an in-depth analysis detailing your home's value as well as a comparison with similar homes in the area
Home Values in the Area
Average Home Value in this Area
Purchase History
| Date | Buyer | Sale Price | Title Company |
|---|---|---|---|
| Picar Zachary Dexter | -- | Accommodation | |
| Picar Zachary Dexter | $790,000 | Tg | |
| Rubio Ricardo Joseph | $500,000 | None Available |
Source: Public Records
Mortgage History
| Date | Status | Borrower | Loan Amount |
|---|---|---|---|
| Open | Picar Zachary Dexter | $592,500 | |
| Previous Owner | Rubio Ricardo Joseph | $300,000 |
Source: Public Records
Tax History Compared to Growth
Tax History
| Year | Tax Paid | Tax Assessment Tax Assessment Total Assessment is a certain percentage of the fair market value that is determined by local assessors to be the total taxable value of land and additions on the property. | Land | Improvement |
|---|---|---|---|---|
| 2025 | $100 | $898,400 | $258,100 | $640,300 |
| 2024 | $100 | $868,300 | $257,900 | $610,400 |
| 2023 | $100 | $802,300 | $234,600 | $567,700 |
| 2022 | $100 | $784,900 | $217,200 | $567,700 |
| 2021 | $2,957 | $600,800 | $155,100 | $445,700 |
| 2020 | $2,849 | $583,300 | $155,100 | $428,200 |
| 2019 | $2,745 | $566,300 | $155,100 | $411,200 |
| 2018 | $2,643 | $549,800 | $155,100 | $394,700 |
| 2017 | $2,545 | $533,800 | $153,300 | $380,500 |
| 2016 | $2,450 | $518,300 | $153,300 | $365,000 |
| 2015 | $2,084 | $503,200 | $153,300 | $349,900 |
| 2014 | $2,084 | $502,600 | $148,000 | $354,600 |
Source: Public Records
Map
Nearby Homes