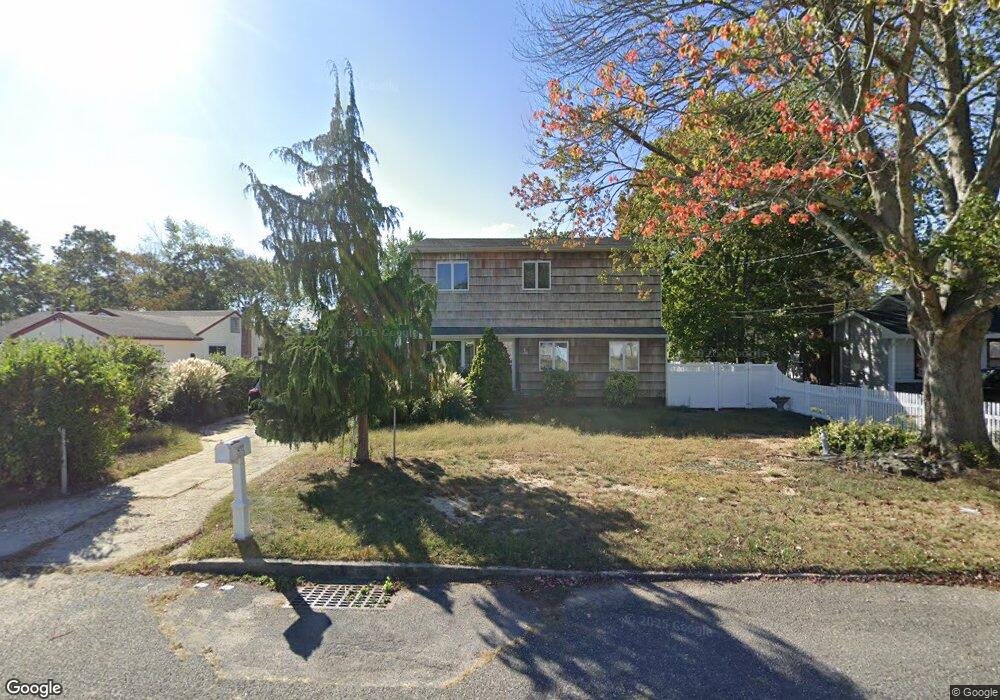
492 Locust St Brentwood, NY 11717
Estimated Value: $559,113 - $679,000
--
Bed
--
Bath
--
Sq Ft
0.26
Acres
About This Home
This home is located at 492 Locust St, Brentwood, NY 11717 and is currently estimated at $611,778. 492 Locust St is a home located in Suffolk County.
Ownership History
Date
Name
Owned For
Owner Type
Purchase Details
Closed on
Dec 5, 2014
Sold by
Vinciguerra Lucy and Intoci Victoria
Bought by
Zublionis Robert
Current Estimated Value
Home Financials for this Owner
Home Financials are based on the most recent Mortgage that was taken out on this home.
Original Mortgage
$275,805
Outstanding Balance
$211,432
Interest Rate
4.02%
Mortgage Type
VA
Estimated Equity
$400,346
Purchase Details
Closed on
Feb 25, 1999
Sold by
Vinciguerra Lucy and Vinciguerra Lucy
Bought by
Intoci Victoria
Create a Home Valuation Report for This Property
The Home Valuation Report is an in-depth analysis detailing your home's value as well as a comparison with similar homes in the area
Home Values in the Area
Average Home Value in this Area
Purchase History
| Date | Buyer | Sale Price | Title Company |
|---|---|---|---|
| Zublionis Robert | $270,000 | None Available | |
| Zublionis Robert | $270,000 | None Available | |
| Intoci Victoria | -- | First American Title Ins Co | |
| Intoci Victoria | -- | First American Title Ins Co |
Source: Public Records
Mortgage History
| Date | Status | Borrower | Loan Amount |
|---|---|---|---|
| Open | Zublionis Robert | $275,805 | |
| Closed | Zublionis Robert | $275,805 |
Source: Public Records
Tax History Compared to Growth
Tax History
| Year | Tax Paid | Tax Assessment Tax Assessment Total Assessment is a certain percentage of the fair market value that is determined by local assessors to be the total taxable value of land and additions on the property. | Land | Improvement |
|---|---|---|---|---|
| 2024 | $9,246 | $40,800 | $7,600 | $33,200 |
| 2023 | $9,246 | $40,800 | $7,600 | $33,200 |
| 2022 | $9,363 | $40,800 | $7,600 | $33,200 |
| 2021 | $9,363 | $40,800 | $7,600 | $33,200 |
| 2020 | $8,429 | $40,800 | $7,600 | $33,200 |
| 2019 | $8,429 | $40,800 | $7,600 | $33,200 |
| 2018 | -- | $40,800 | $7,600 | $33,200 |
| 2017 | $7,897 | $40,800 | $7,600 | $33,200 |
| 2016 | $7,812 | $40,800 | $7,600 | $33,200 |
| 2015 | -- | $40,800 | $7,600 | $33,200 |
| 2014 | -- | $39,800 | $7,600 | $32,200 |
Source: Public Records
Map
Nearby Homes