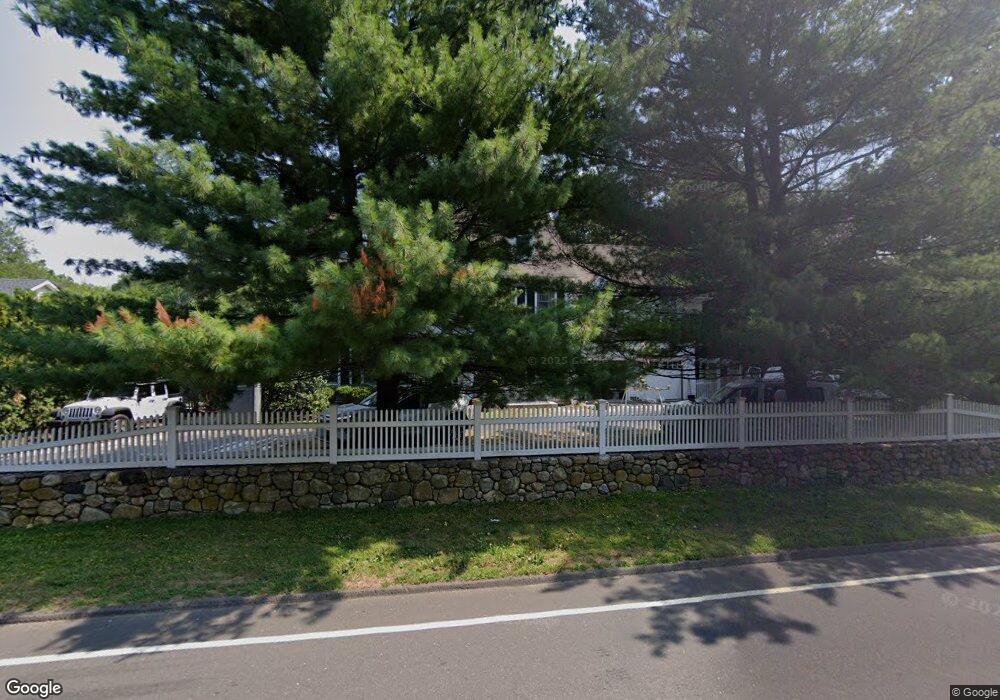
492 Main St New Canaan, CT 06840
Estimated Value: $2,311,431 - $2,957,000
4
Beds
5
Baths
3,261
Sq Ft
$780/Sq Ft
Est. Value
About This Home
This home is located at 492 Main St, New Canaan, CT 06840 and is currently estimated at $2,542,858, approximately $779 per square foot. 492 Main St is a home located in Fairfield County with nearby schools including South Elementary School, Saxe Middle School, and New Canaan High School.
Ownership History
Date
Name
Owned For
Owner Type
Purchase Details
Closed on
Apr 30, 2013
Sold by
Aldrich Michael M and Aldrich Mary D
Bought by
Candee William T and Candee Emily C
Current Estimated Value
Home Financials for this Owner
Home Financials are based on the most recent Mortgage that was taken out on this home.
Original Mortgage
$1,220,000
Interest Rate
2.88%
Mortgage Type
Adjustable Rate Mortgage/ARM
Purchase Details
Closed on
Jul 31, 2003
Sold by
Lem Wesley and Pan Susan
Bought by
Aldrich Michael H and Aldrich Mary D
Purchase Details
Closed on
Mar 16, 1999
Sold by
Psc Dev Llc
Bought by
Lem Wesley and Pan Susan
Home Financials for this Owner
Home Financials are based on the most recent Mortgage that was taken out on this home.
Original Mortgage
$550,000
Interest Rate
6.38%
Purchase Details
Closed on
Jul 1, 1998
Sold by
Christie Janet S
Bought by
Psc Dev Llc
Create a Home Valuation Report for This Property
The Home Valuation Report is an in-depth analysis detailing your home's value as well as a comparison with similar homes in the area
Home Values in the Area
Average Home Value in this Area
Purchase History
| Date | Buyer | Sale Price | Title Company |
|---|---|---|---|
| Candee William T | $1,525,000 | -- | |
| Aldrich Michael H | $1,212,500 | -- | |
| Lem Wesley | $820,000 | -- | |
| Psc Dev Llc | $260,000 | -- |
Source: Public Records
Mortgage History
| Date | Status | Borrower | Loan Amount |
|---|---|---|---|
| Open | Psc Dev Llc | $1,146,000 | |
| Closed | Psc Dev Llc | $1,220,000 | |
| Previous Owner | Psc Dev Llc | $550,000 |
Source: Public Records
Tax History Compared to Growth
Tax History
| Year | Tax Paid | Tax Assessment Tax Assessment Total Assessment is a certain percentage of the fair market value that is determined by local assessors to be the total taxable value of land and additions on the property. | Land | Improvement |
|---|---|---|---|---|
| 2025 | $20,396 | $1,222,060 | $546,840 | $675,220 |
| 2024 | $19,724 | $1,222,060 | $546,840 | $675,220 |
| 2023 | $18,088 | $955,010 | $485,730 | $469,280 |
| 2022 | $17,544 | $955,010 | $485,730 | $469,280 |
| 2021 | $17,343 | $955,010 | $485,730 | $469,280 |
| 2020 | $17,343 | $955,010 | $485,730 | $469,280 |
| 2019 | $17,419 | $955,010 | $485,730 | $469,280 |
| 2018 | $17,474 | $1,030,330 | $449,750 | $580,580 |
| 2017 | $17,176 | $1,030,330 | $449,750 | $580,580 |
| 2016 | $16,805 | $1,030,330 | $449,750 | $580,580 |
| 2015 | $17,062 | $1,030,330 | $449,750 | $580,580 |
| 2014 | $16,011 | $1,030,330 | $449,750 | $580,580 |
Source: Public Records
Map
Nearby Homes
- 31 Selleck Place
- 12 Lincoln Dr
- 50 Harrison Ave
- 354 South Ave
- 25 Gower Rd
- 44 Putnam Rd
- 180 Summer St
- 52 Putnam Rd
- 216 White Oak Shade Rd
- 38 Fitch Ln
- 317 Park St
- 63 Middle Ridge Rd
- 184 Marvin Ridge Rd
- 197 Park St Unit 13
- 289 New Norwalk Rd Unit 22
- 64 East Ave
- 15 Burtis Ave Unit Townhome D
- 15 Burtis Ave Unit West Penthouse B
- 15 Burtis Ave Unit East Penthouse C
- 15 Burtis Ave Unit Townhome A
- 502 Main St
- 486 Main St
- 508 Main St
- 482 Main St
- 137 Elm Place
- 503 Main St
- 474 Main St Unit B
- 474 Main St Unit A
- 474 Main St Unit South
- 474 Main St Unit North
- 474 Main St Unit A-B
- 474 Main St Unit South A
- 474 Main St Unit South (B)
- 474 Main St Unit North (B)
- 474 Main St Unit A (South)
- 518 Main St
- 140 Elm Place
- 468 Main St
- 129 Elm Place
- 124 Elm Place