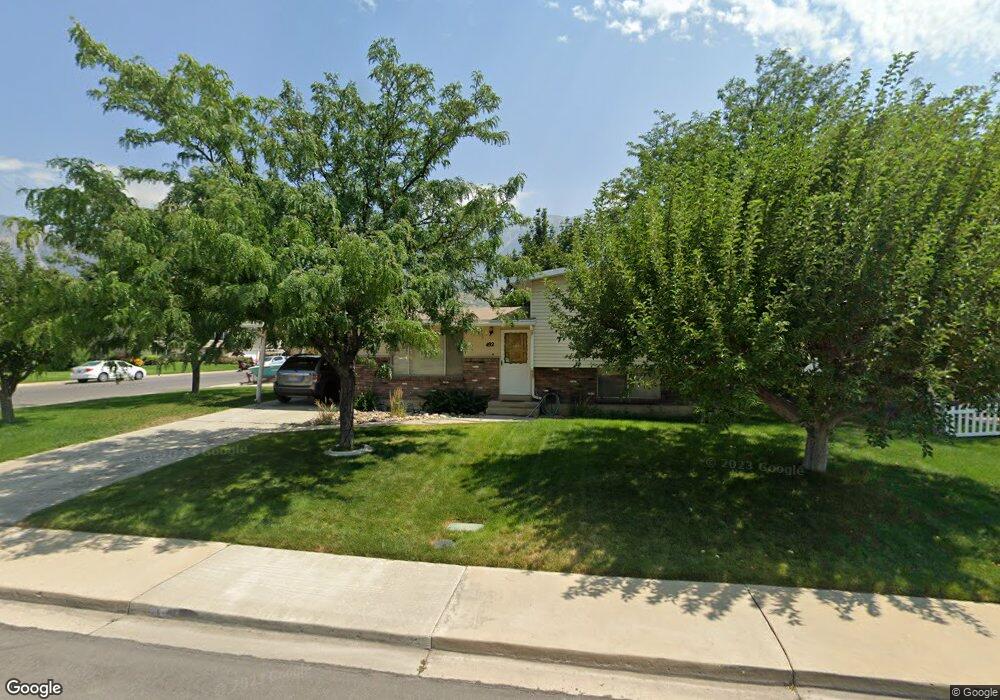
492 N 1120 E Orem, UT 84097
Orchard South NeighborhoodEstimated Value: $476,000 - $555,000
4
Beds
2
Baths
1,988
Sq Ft
$257/Sq Ft
Est. Value
About This Home
**OPEN HOUSE Saturday 7-12-25 from 12pm-12:30pm for anyone who wants to come see it be at the open house**4 bed 2 bath Single Family home in North East Orem!! This is the location you have been waiting for!! Check out the pictures on the listing!! Must pass credit/background check. This one will go fast!! NO PETS, NO SMOKING!
Ownership History
Date
Name
Owned For
Owner Type
Purchase Details
Closed on
May 7, 2012
Sold by
Huntsman Nathan and Huntsman Sarah
Bought by
Sessions Roy D and Sessions Elaine
Current Estimated Value
Purchase Details
Closed on
Nov 15, 2007
Sold by
Return On Investments Inc
Bought by
Huntsman Nathan and Huntsman Sarah
Home Financials for this Owner
Home Financials are based on the most recent Mortgage that was taken out on this home.
Original Mortgage
$232,000
Interest Rate
6.35%
Mortgage Type
Purchase Money Mortgage
Purchase Details
Closed on
Jul 31, 2007
Sold by
Robinson Phillip and Robinson Judy
Bought by
Return On Investments Inc
Create a Home Valuation Report for This Property
The Home Valuation Report is an in-depth analysis detailing your home's value as well as a comparison with similar homes in the area
Home Values in the Area
Average Home Value in this Area
Purchase History
| Date | Buyer | Sale Price | Title Company |
|---|---|---|---|
| Sessions Roy D | -- | None Available | |
| Huntsman Nathan | -- | Wasatch Title Insurance Age | |
| Return On Investments Inc | -- | Utah First Title Insurance |
Source: Public Records
Mortgage History
| Date | Status | Borrower | Loan Amount |
|---|---|---|---|
| Previous Owner | Huntsman Nathan | $232,000 |
Source: Public Records
Property History
| Date | Event | Price | List to Sale | Price per Sq Ft |
|---|---|---|---|---|
| 07/23/2025 07/23/25 | Off Market | $2,195 | -- | -- |
| 05/15/2025 05/15/25 | For Rent | $2,195 | -- | -- |
Tax History
| Year | Tax Paid | Tax Assessment Tax Assessment Total Assessment is a certain percentage of the fair market value that is determined by local assessors to be the total taxable value of land and additions on the property. | Land | Improvement |
|---|---|---|---|---|
| 2025 | $2,118 | $258,995 | -- | -- |
| 2024 | $2,118 | $258,940 | $0 | $0 |
| 2023 | $1,967 | $258,555 | $0 | $0 |
| 2022 | $2,009 | $255,750 | $0 | $0 |
| 2021 | $1,676 | $323,200 | $150,800 | $172,400 |
| 2020 | $1,528 | $289,600 | $120,600 | $169,000 |
| 2019 | $1,364 | $268,800 | $110,000 | $158,800 |
| 2018 | $1,298 | $244,500 | $106,400 | $138,100 |
| 2017 | $1,177 | $118,745 | $0 | $0 |
| 2016 | $1,037 | $96,470 | $0 | $0 |
| 2015 | $890 | $87,065 | $0 | $0 |
| 2014 | $972 | $85,085 | $0 | $0 |
Source: Public Records
Map
Nearby Homes
Your Personal Tour Guide
Ask me questions while you tour the home.