Estimated Value: $634,000 - $852,000
4
Beds
4
Baths
3,563
Sq Ft
$209/Sq Ft
Est. Value
About This Home
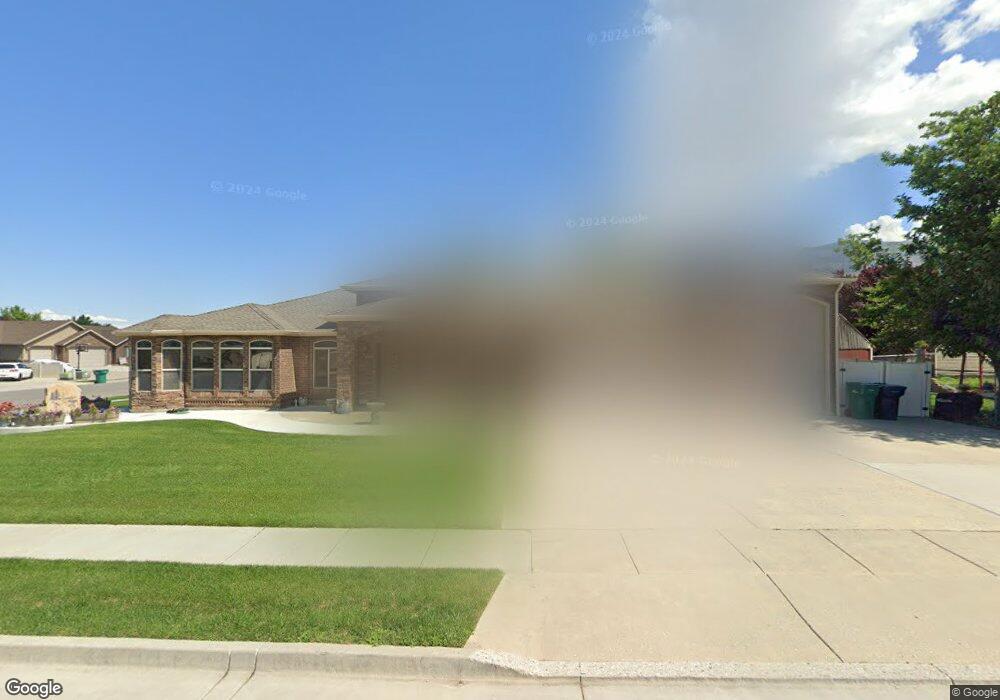
This home is located at 492 W 2425 N, Ogden, UT 84414 and is currently estimated at $744,714, approximately $209 per square foot. 492 W 2425 N is a home located in Weber County with nearby schools including Majestic Elementary School, Orion Junior High School, and Weber High School.
Ownership History
Date
Name
Owned For
Owner Type
Purchase Details
Closed on
Mar 20, 2008
Sold by
Martin Brian K
Bought by
Martin Brian K and Duran Martin Tammy M
Current Estimated Value
Home Financials for this Owner
Home Financials are based on the most recent Mortgage that was taken out on this home.
Original Mortgage
$405,000
Outstanding Balance
$251,088
Interest Rate
5.65%
Mortgage Type
New Conventional
Estimated Equity
$493,626
Purchase Details
Closed on
Jan 17, 2008
Sold by
Martin Brian K and Duran Martin Tammy M
Bought by
Martin Brian K
Purchase Details
Closed on
Aug 17, 2007
Sold by
Cm Real Estate Llc
Bought by
Martin Brian K and Duran Martin Tammy M
Purchase Details
Closed on
Mar 13, 2007
Sold by
Lowe Matthew J
Bought by
Cm Real Estate Investments
Create a Home Valuation Report for This Property
The Home Valuation Report is an in-depth analysis detailing your home's value as well as a comparison with similar homes in the area
Home Values in the Area
Average Home Value in this Area
Purchase History
| Date | Buyer | Sale Price | Title Company |
|---|---|---|---|
| Martin Brian K | -- | Executive Title | |
| Martin Brian K | -- | Executive Title | |
| Martin Brian K | -- | Teton Title Ins Agency | |
| Cm Real Estate Investments | -- | Teton Title Insurance Agency |
Source: Public Records
Mortgage History
| Date | Status | Borrower | Loan Amount |
|---|---|---|---|
| Open | Martin Brian K | $405,000 |
Source: Public Records
Tax History
| Year | Tax Paid | Tax Assessment Tax Assessment Total Assessment is a certain percentage of the fair market value that is determined by local assessors to be the total taxable value of land and additions on the property. | Land | Improvement |
|---|---|---|---|---|
| 2025 | $5,058 | $746,449 | $175,006 | $571,443 |
| 2024 | $4,828 | $392,148 | $96,253 | $295,895 |
| 2023 | $4,190 | $341,000 | $96,250 | $244,750 |
| 2022 | $4,179 | $348,150 | $82,502 | $265,648 |
| 2021 | $3,760 | $577,000 | $95,026 | $481,974 |
| 2020 | $3,496 | $495,000 | $84,918 | $410,082 |
| 2019 | $3,601 | $485,000 | $84,918 | $400,082 |
| 2018 | $3,740 | $484,000 | $84,918 | $399,082 |
| 2017 | $2,951 | $354,000 | $70,045 | $283,955 |
| 2016 | $2,984 | $194,453 | $33,010 | $161,443 |
| 2015 | $2,813 | $181,149 | $33,010 | $148,139 |
| 2014 | $3,375 | $216,916 | $27,575 | $189,341 |
Source: Public Records
Map
Nearby Homes
- 2382 N 450 W
- 2303 N 300 W
- 2434 N Dorchester Ave
- 2517 N Dorchester Ave
- 97 W 2200 N
- 2516 N Dorchester Ave
- 2448 N Williamsburg Ave
- 113 Hillsborough Dr
- 2267 N 225 W
- 615 Fox Meadow Dr
- 2205 N 700 W
- 759 W Fox Meadow Dr
- 133 Arlington Way
- 747 W 2775 N
- 307 Willow Way
- 2437 Charleston Ave
- 2511 Charleston Ave
- 255 W 2700 N Unit 12
- 304 W Willow Way
- 69 White Barn Dr
Your Personal Tour Guide
Ask me questions while you tour the home.