492 W 450 N Hobart, IN 46342
Porter County NeighborhoodEstimated Value: $431,000 - $533,479
3
Beds
2
Baths
2,468
Sq Ft
$186/Sq Ft
Est. Value
About This Home
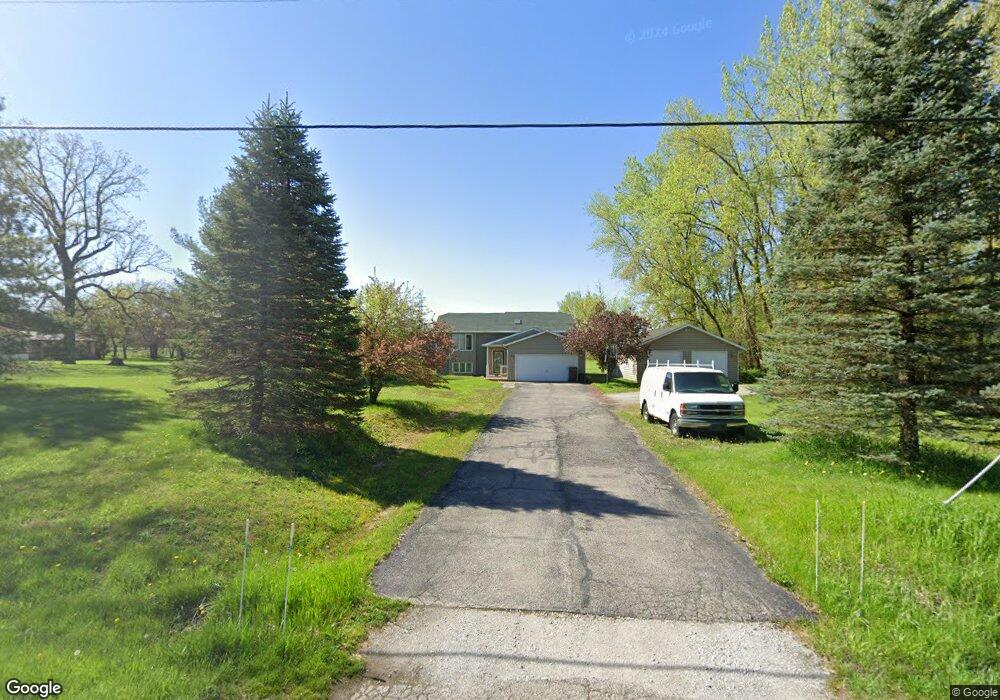
This home is located at 492 W 450 N, Hobart, IN 46342 and is currently estimated at $458,870, approximately $185 per square foot. 492 W 450 N is a home located in Porter County with nearby schools including Union Township Middle School, Wheeler High School, and Emmanuel Baptist Academy.
Ownership History
Date
Name
Owned For
Owner Type
Purchase Details
Closed on
Mar 28, 2025
Sold by
Mary E Loudermilk Family Trust and Loudermilk John R
Bought by
John R Loudermilk Living Trust and Loudermilk
Current Estimated Value
Purchase Details
Closed on
Nov 6, 2009
Sold by
Loudermilk John R and Mary E Loudermilk Living Trust
Bought by
Loudermilk John R and Mary E Loudermilk Family Trust
Purchase Details
Closed on
Sep 1, 1999
Sold by
Loudermilk John R and Loudermilk Mary E
Bought by
Loudermilk Mary E and Loudermilk John R
Create a Home Valuation Report for This Property
The Home Valuation Report is an in-depth analysis detailing your home's value as well as a comparison with similar homes in the area
Home Values in the Area
Average Home Value in this Area
Purchase History
| Date | Buyer | Sale Price | Title Company |
|---|---|---|---|
| John R Loudermilk Living Trust | -- | None Listed On Document | |
| Loudermilk John R | -- | None Available | |
| Loudermilk Mary E | -- | None Available |
Source: Public Records
Tax History Compared to Growth
Tax History
| Year | Tax Paid | Tax Assessment Tax Assessment Total Assessment is a certain percentage of the fair market value that is determined by local assessors to be the total taxable value of land and additions on the property. | Land | Improvement |
|---|---|---|---|---|
| 2024 | $6,016 | $417,800 | $102,500 | $315,300 |
| 2023 | $5,476 | $380,600 | $89,800 | $290,800 |
| 2022 | $5,336 | $356,500 | $89,800 | $266,700 |
| 2021 | $5,129 | $325,800 | $89,800 | $236,000 |
| 2020 | $4,978 | $302,200 | $78,300 | $223,900 |
| 2019 | $4,635 | $278,000 | $78,300 | $199,700 |
| 2018 | $4,936 | $272,800 | $78,300 | $194,500 |
| 2017 | $4,478 | $268,800 | $78,300 | $190,500 |
| 2016 | $4,434 | $272,500 | $87,200 | $185,300 |
| 2014 | $3,781 | $214,000 | $40,200 | $173,800 |
| 2013 | -- | $222,200 | $41,300 | $180,900 |
Source: Public Records
Map
Nearby Homes
- 424A Salt Creek Pkwy
- 421 Sandalwood Dr
- 384 Sandalwood Dr
- 364 Rainier Rd
- 372 Raven Ct
- 385 Riviera Ct
- 536 Riviera Rd
- 375 N 650 W
- 321 W 400 N
- 631 Osage Rd
- 628 Old Forge Rd
- 427 N State Road 149
- 637 Old Forge Rd
- 640 Old Forge Rd
- 536 W Us Highway 30
- 286 State Route 130
- 397 W US Highway 30
- 279 Robbie Ln
- 1950 St Road 130
- 411 Nantucket Rd