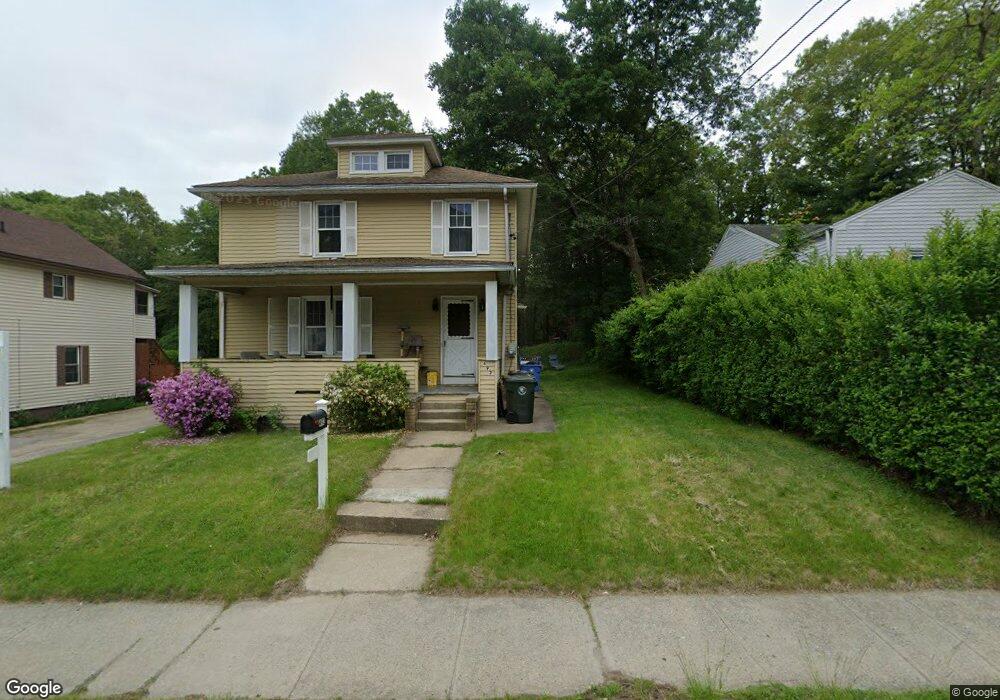
492 W Main St Norwich, CT 06360
Central Norwich NeighborhoodEstimated Value: $246,000 - $276,000
3
Beds
1
Bath
1,552
Sq Ft
$169/Sq Ft
Est. Value
About This Home
This home is located at 492 W Main St, Norwich, CT 06360 and is currently estimated at $262,641, approximately $169 per square foot. 492 W Main St is a home located in New London County with nearby schools including Samuel Huntington Elementary School, Kelly STEAM Magnet Middle School, and Integrated Day Charter School.
Ownership History
Date
Name
Owned For
Owner Type
Purchase Details
Closed on
Feb 26, 2018
Sold by
Mulcahy Cathleen and Coleman John J
Bought by
Evergreen Properties L
Current Estimated Value
Home Financials for this Owner
Home Financials are based on the most recent Mortgage that was taken out on this home.
Original Mortgage
$75,000
Outstanding Balance
$43,060
Interest Rate
3.99%
Mortgage Type
Credit Line Revolving
Estimated Equity
$219,581
Create a Home Valuation Report for This Property
The Home Valuation Report is an in-depth analysis detailing your home's value as well as a comparison with similar homes in the area
Home Values in the Area
Average Home Value in this Area
Purchase History
| Date | Buyer | Sale Price | Title Company |
|---|---|---|---|
| Evergreen Properties L | -- | -- | |
| Evergreen Properties L | -- | -- |
Source: Public Records
Mortgage History
| Date | Status | Borrower | Loan Amount |
|---|---|---|---|
| Open | Evergreen Properties L | $75,000 | |
| Closed | Evergreen Properties L | $75,000 |
Source: Public Records
Tax History Compared to Growth
Tax History
| Year | Tax Paid | Tax Assessment Tax Assessment Total Assessment is a certain percentage of the fair market value that is determined by local assessors to be the total taxable value of land and additions on the property. | Land | Improvement |
|---|---|---|---|---|
| 2025 | $4,877 | $120,500 | $41,700 | $78,800 |
| 2024 | $4,603 | $120,500 | $41,700 | $78,800 |
| 2023 | $3,492 | $71,800 | $23,900 | $47,900 |
| 2022 | $3,481 | $71,800 | $23,900 | $47,900 |
| 2021 | $3,492 | $71,800 | $23,900 | $47,900 |
| 2020 | $3,480 | $71,800 | $23,900 | $47,900 |
| 2019 | $3,446 | $71,800 | $23,900 | $47,900 |
| 2018 | $3,503 | $72,400 | $20,500 | $51,900 |
| 2017 | $3,612 | $74,100 | $20,500 | $53,600 |
| 2016 | $3,635 | $74,100 | $20,500 | $53,600 |
| 2015 | $3,561 | $74,100 | $20,500 | $53,600 |
| 2014 | $3,403 | $74,100 | $20,500 | $53,600 |
Source: Public Records
Map
Nearby Homes
- 499 N Main St
- 471 N Main St
- 471 N Main St
- 471 N Main St
- 455 N Main St
- 110 Broadway
- 110 Broadway Unit 2
- 87 Broadway
- 120 Broadway
- 120 Broadway Unit 3
- 120 Broadway Unit 2
- 125 Broadway
- 123 Broadway Unit 1
- 123 Broadway
- 122 Broadway
- 124 Broadway
- 127 1/2 Broadway
- 126 Broadway
- 129 Broadway
- 129 Broadway Unit 2