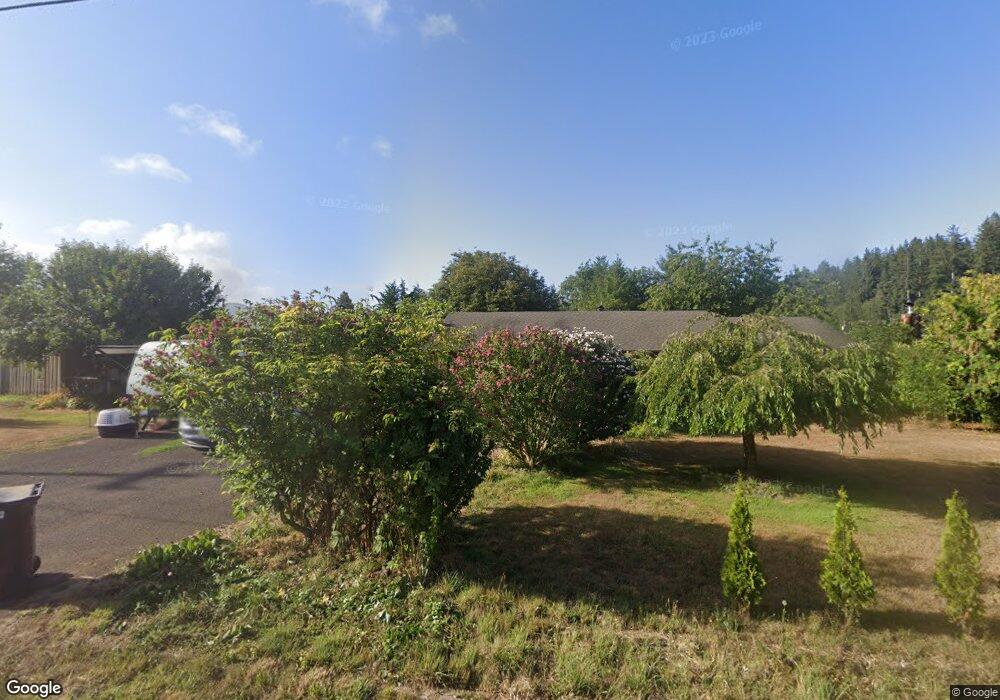
4920 Brickyard Rd Tillamook, OR 97141
Estimated Value: $448,000 - $531,000
4
Beds
3
Baths
2,100
Sq Ft
$240/Sq Ft
Est. Value
About This Home
This home is located at 4920 Brickyard Rd, Tillamook, OR 97141 and is currently estimated at $504,656, approximately $240 per square foot. 4920 Brickyard Rd is a home located in Tillamook County with nearby schools including Tillamook High School and Hendrickson Academy.
Ownership History
Date
Name
Owned For
Owner Type
Purchase Details
Closed on
Sep 28, 2023
Sold by
Pdx Fund Llc
Bought by
Crusan Marc
Current Estimated Value
Purchase Details
Closed on
Jan 24, 2023
Sold by
Marc Crusac
Bought by
Pdx Fund Llc
Purchase Details
Closed on
Mar 16, 2016
Sold by
Bunnell Scott E and Bunnell Maribel A
Bought by
Crusan Marc F
Home Financials for this Owner
Home Financials are based on the most recent Mortgage that was taken out on this home.
Original Mortgage
$240,562
Interest Rate
3.5%
Mortgage Type
FHA
Purchase Details
Closed on
Jan 8, 2009
Sold by
Bunnell Scott E and Bunnell Maribel A
Bought by
Bunnell Scott E and Bunnell Maribel A
Home Financials for this Owner
Home Financials are based on the most recent Mortgage that was taken out on this home.
Original Mortgage
$98,000
Interest Rate
5.97%
Mortgage Type
New Conventional
Create a Home Valuation Report for This Property
The Home Valuation Report is an in-depth analysis detailing your home's value as well as a comparison with similar homes in the area
Home Values in the Area
Average Home Value in this Area
Purchase History
| Date | Buyer | Sale Price | Title Company |
|---|---|---|---|
| Crusan Marc | -- | None Listed On Document | |
| Crusan Marc | -- | None Listed On Document | |
| Pdx Fund Llc | -- | -- | |
| Crusan Marc F | $245,000 | First American | |
| Bunnell Scott E | -- | First American |
Source: Public Records
Mortgage History
| Date | Status | Borrower | Loan Amount |
|---|---|---|---|
| Previous Owner | Crusan Marc F | $240,562 | |
| Previous Owner | Bunnell Scott E | $98,000 |
Source: Public Records
Tax History Compared to Growth
Tax History
| Year | Tax Paid | Tax Assessment Tax Assessment Total Assessment is a certain percentage of the fair market value that is determined by local assessors to be the total taxable value of land and additions on the property. | Land | Improvement |
|---|---|---|---|---|
| 2024 | $2,887 | $290,030 | $83,590 | $206,440 |
| 2023 | $2,871 | $281,590 | $81,160 | $200,430 |
| 2022 | $2,769 | $273,390 | $78,800 | $194,590 |
| 2021 | $2,687 | $265,430 | $76,500 | $188,930 |
| 2020 | $2,614 | $257,700 | $74,270 | $183,430 |
| 2019 | $2,549 | $250,200 | $72,110 | $178,090 |
| 2018 | $2,484 | $242,920 | $70,010 | $172,910 |
| 2017 | $2,423 | $235,850 | $67,970 | $167,880 |
| 2016 | $2,124 | $212,810 | $65,990 | $146,820 |
| 2015 | $2,113 | $206,620 | $64,070 | $142,550 |
| 2014 | $2,013 | $200,610 | $62,200 | $138,410 |
| 2013 | -- | $194,770 | $60,390 | $134,380 |
Source: Public Records
Map
Nearby Homes
- 9225 Millcreek Rd
- 9225 Mill Creek Rd
- 9065 Trask River Rd
- 7400 S Prairie Rd
- 0 Edelwyss Rd Unit TL 405 25-357
- 0 Edelwyss Rd Unit 405 731536279
- 0 Valley View Dr Unit 24275744
- 1690 Skyline Dr
- 10360 Skyview Rd
- 810 Marvin Rd
- 0 Skyview Rd Unit 41 424877504
- 0 Skyview Rd Unit 410604 427457611
- 6500 Weber Rd
- 650 Marvin Rd
- 5305 Kenway Dr
- V/L Marolf Loop Rd
- 4205 Ginkgo Ave
- 01400 Blaser Ln
- TL #01400 Blaser Ln
- 1110 Meadow Ave
- 4800 Brickyard Rd
- 4835 Brickyard Rd
- 4940 Brickyard Rd
- 4750 Brickyard Rd
- 5000 Brickyard Rd
- 4760 Brickyard Rd
- 4915 Brickyard Rd
- 4935 Brickyard Rd
- 4735 Brickyard Rd
- 4790 Brickyard Rd
- 4929 Brickyard Rd
- 5050 Brickyard Rd
- 4740 Brickyard Rd
- 4700 Brickyard Rd
- 4700 Brickyard Rd
- 4640 Brickyard Rd
- 4630 Brickyard Rd
- 5120 Brickyard Rd
- 5106 Brickyard Rd
- 8820 Mill Creek Rd