Estimated Value: $361,000 - $447,000
Studio
2
Baths
1,496
Sq Ft
$268/Sq Ft
Est. Value
About This Home
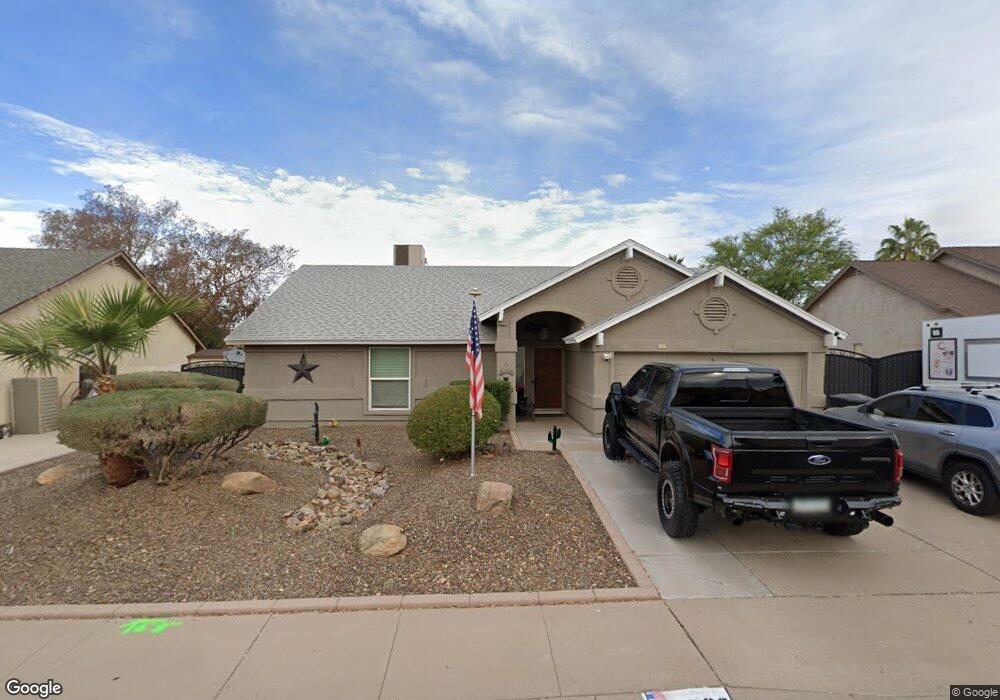
This home is located at 4920 E Halifax St, Mesa, AZ 85205 and is currently estimated at $401,526, approximately $268 per square foot. 4920 E Halifax St is a home located in Maricopa County with nearby schools including Bush Elementary School, Franklin at Brimhall Elementary School, and Franklin West Elementary School.
Ownership History
Date
Name
Owned For
Owner Type
Purchase Details
Closed on
Jan 5, 2006
Sold by
Bradford Jerry R
Bought by
Bradford Jerry R
Current Estimated Value
Home Financials for this Owner
Home Financials are based on the most recent Mortgage that was taken out on this home.
Original Mortgage
$130,000
Outstanding Balance
$73,286
Interest Rate
6.32%
Mortgage Type
New Conventional
Estimated Equity
$328,240
Purchase Details
Closed on
Dec 9, 2002
Sold by
Bradford Zelda Y
Bought by
Bradford Zelda Y and The Zelda Y Bradford Family Living Trust
Purchase Details
Closed on
Aug 2, 2001
Sold by
Sheppard Edgar F and Sheppard Roberta E
Bought by
Bradford William R and Bradford Zelda Y
Home Financials for this Owner
Home Financials are based on the most recent Mortgage that was taken out on this home.
Original Mortgage
$25,000
Interest Rate
7.05%
Mortgage Type
New Conventional
Create a Home Valuation Report for This Property
The Home Valuation Report is an in-depth analysis detailing your home's value as well as a comparison with similar homes in the area
Purchase History
| Date | Buyer | Sale Price | Title Company |
|---|---|---|---|
| Bradford Jerry R | -- | Guaranty Title Agency | |
| Bradford Zelda Y | -- | -- | |
| Bradford William R | $117,900 | Security Title Agency |
Source: Public Records
Mortgage History
| Date | Status | Borrower | Loan Amount |
|---|---|---|---|
| Open | Bradford Jerry R | $130,000 | |
| Closed | Bradford William R | $25,000 |
Source: Public Records
Tax History
| Year | Tax Paid | Tax Assessment Tax Assessment Total Assessment is a certain percentage of the fair market value that is determined by local assessors to be the total taxable value of land and additions on the property. | Land | Improvement |
|---|---|---|---|---|
| 2025 | $1,356 | $16,330 | -- | -- |
| 2024 | $1,371 | $15,553 | -- | -- |
| 2023 | $1,371 | $29,600 | $5,920 | $23,680 |
| 2022 | $1,341 | $22,650 | $4,530 | $18,120 |
| 2021 | $1,378 | $21,280 | $4,250 | $17,030 |
| 2020 | $1,359 | $19,280 | $3,850 | $15,430 |
| 2019 | $1,259 | $17,810 | $3,560 | $14,250 |
| 2018 | $1,202 | $15,620 | $3,120 | $12,500 |
| 2017 | $1,164 | $14,820 | $2,960 | $11,860 |
| 2016 | $1,143 | $14,030 | $2,800 | $11,230 |
| 2015 | $1,080 | $13,360 | $2,670 | $10,690 |
Source: Public Records
Map
Nearby Homes
- 4747 E Hannibal St
- 4746 E Hannibal St
- 1358 N St Paul --
- 5022 E Glencove St
- 1525 N Balboa
- 1543 N Balboa
- 5011 E Greenway St
- 4716 E Greenway St Unit 4
- 4729 E Greenway St
- 4528 E Hobart St
- 5244 E Hannibal St
- 4913 E Fox St
- 5230 E Brown Rd Unit 269
- 5230 E Brown Rd Unit 110
- 1533 N Sinova
- 4725 E Brown Rd Unit 70
- 5345 E Mclellan Rd Unit 27
- 5345 E Mclellan Rd Unit 119
- 5345 E Mclellan Rd Unit 114
- 5345 E Mclellan Rd Unit 5
- 4928 E Halifax St
- 4912 E Halifax St
- 4915 E Hobart St
- 4905 E Hobart St
- 4923 E Hobart St
- 4936 E Halifax St
- 4904 E Halifax St
- 4925 E Halifax St
- 4933 E Halifax St
- 4931 E Hobart St
- 4853 E Hobart St
- 4864 E Halifax St
- 4944 E Halifax St
- 1539 N Rochester Cir
- 4941 E Halifax St
- 4939 E Hobart St
- 4942 E Princess Dr
- 4865 E Halifax St
- 4948 E Princess Dr
- 4845 E Hobart St
Your Personal Tour Guide
Ask me questions while you tour the home.