Estimated Value: $169,000 - $186,000
3
Beds
2
Baths
1,366
Sq Ft
$131/Sq Ft
Est. Value
About This Home
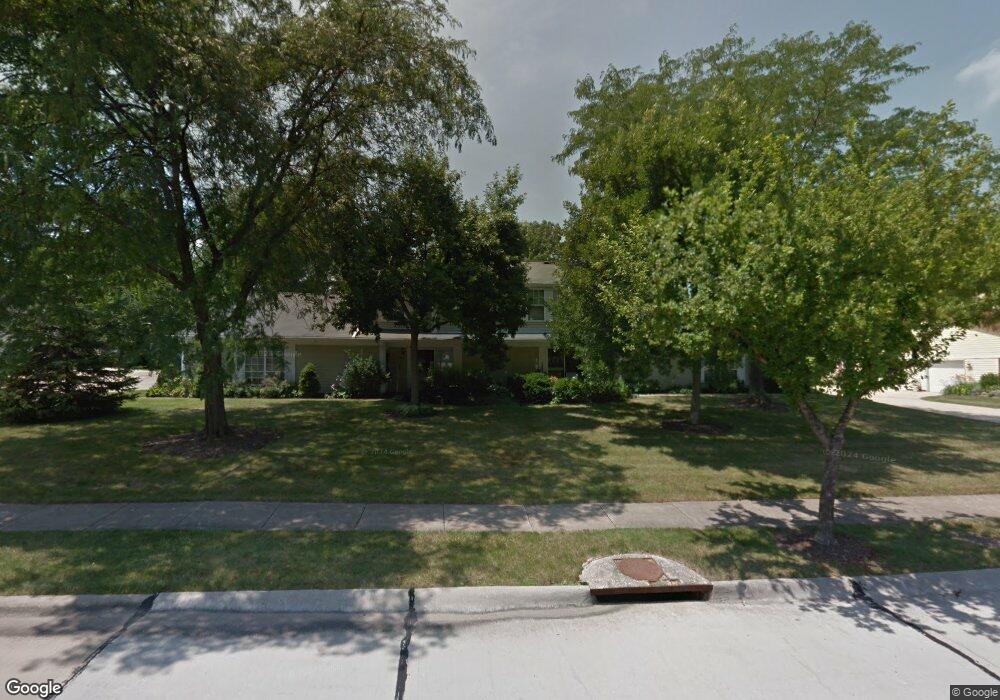
This home is located at 4920 Friar Rd, Stow, OH 44224 and is currently estimated at $179,169, approximately $131 per square foot. 4920 Friar Rd is a home located in Summit County with nearby schools including Stow-Munroe Falls High School, Primrose School of Hudson, and Holy Family Elementary School.
Ownership History
Date
Name
Owned For
Owner Type
Purchase Details
Closed on
May 24, 2021
Sold by
Hoggarth Kathleen Ann
Bought by
Schaffer Ronald A and De Schaffer Monica
Current Estimated Value
Home Financials for this Owner
Home Financials are based on the most recent Mortgage that was taken out on this home.
Original Mortgage
$101,600
Outstanding Balance
$91,931
Interest Rate
3%
Mortgage Type
New Conventional
Estimated Equity
$87,238
Purchase Details
Closed on
Dec 14, 2018
Sold by
Hoggarth Andrew and Hoggarth Amanda Rose
Bought by
Hoggarth Kathleen Ann
Purchase Details
Closed on
Jul 24, 2015
Sold by
Miller Debra M
Bought by
Hoggarth Andrew
Purchase Details
Closed on
Mar 21, 1996
Sold by
Adkins Dorothy M
Bought by
Miller Debra M
Home Financials for this Owner
Home Financials are based on the most recent Mortgage that was taken out on this home.
Original Mortgage
$70,200
Interest Rate
7.06%
Mortgage Type
New Conventional
Create a Home Valuation Report for This Property
The Home Valuation Report is an in-depth analysis detailing your home's value as well as a comparison with similar homes in the area
Home Values in the Area
Average Home Value in this Area
Purchase History
| Date | Buyer | Sale Price | Title Company |
|---|---|---|---|
| Schaffer Ronald A | $127,000 | American Kingdom | |
| Hoggarth Kathleen Ann | -- | None Available | |
| Hoggarth Andrew | $74,000 | Allegiance | |
| Miller Debra M | $78,000 | -- |
Source: Public Records
Mortgage History
| Date | Status | Borrower | Loan Amount |
|---|---|---|---|
| Open | Schaffer Ronald A | $101,600 | |
| Previous Owner | Miller Debra M | $70,200 |
Source: Public Records
Tax History Compared to Growth
Tax History
| Year | Tax Paid | Tax Assessment Tax Assessment Total Assessment is a certain percentage of the fair market value that is determined by local assessors to be the total taxable value of land and additions on the property. | Land | Improvement |
|---|---|---|---|---|
| 2025 | $4,167 | $50,166 | $5,075 | $45,091 |
| 2024 | $2,855 | $50,166 | $5,075 | $45,091 |
| 2023 | $4,167 | $50,166 | $5,075 | $45,091 |
| 2022 | $2,368 | $36,621 | $3,707 | $32,914 |
| 2021 | $2,124 | $36,621 | $3,707 | $32,914 |
| 2020 | $2,088 | $36,620 | $3,710 | $32,910 |
| 2019 | $1,779 | $27,050 | $3,670 | $23,380 |
| 2018 | $1,636 | $27,050 | $3,670 | $23,380 |
| 2017 | $1,495 | $27,050 | $3,670 | $23,380 |
| 2016 | $1,538 | $23,950 | $3,670 | $20,280 |
| 2015 | $1,495 | $23,950 | $3,670 | $20,280 |
| 2014 | $1,496 | $23,950 | $3,610 | $20,340 |
| 2013 | $1,821 | $29,560 | $3,610 | $25,950 |
Source: Public Records
Map
Nearby Homes
- 4901 Independence Cir Unit B
- 4917 Independence Cir Unit B
- 4621 Graford Ln
- 2444 Port Charles Dr
- 2418 Wrens Dr S Unit G
- 2380 Port Williams Dr Unit 2380
- 4903 Fishcreek Rd Unit 11B
- 0 Stow Rd Unit 5102979
- 4901 Pebblehurst Dr
- 4731 Haughton Ct
- 2327 Crockett Cir
- 2140 Woodlawn Cir Unit 2144
- 4227 Baird Rd
- 4131 Burton Dr
- 2028 Willowdale Dr
- 4120 Klein Ave
- 1995 Willowdale Dr
- 1627 Cypress Ct
- 5465 Park Vista Ct
- 3165 Peterboro Dr
- 4920 Friar Rd Unit 7D
- 4920 Friar Rd
- 4920 Friar Rd Unit 7A
- 4920 Friar Rd Unit A
- 4920 Friar Rd Unit D
- 4920 Friar Rd Unit B
- 4916 Friar Rd Unit A
- 4916 Friar Rd
- 4916 Friar Rd
- 4916 Friar Rd
- 4916 Friar Rd
- 4745 Emerald Woods Dr
- 4924 Friar Rd
- 4924 Friar Rd Unit C
- 4924 Friar Rd
- 4924 Friar Rd Unit 6D
- 4924 Friar Rd Unit D
- 4924 Friar Rd Unit B
- 4725 Emerald Woods Dr
- 4753 Emerald Woods Dr