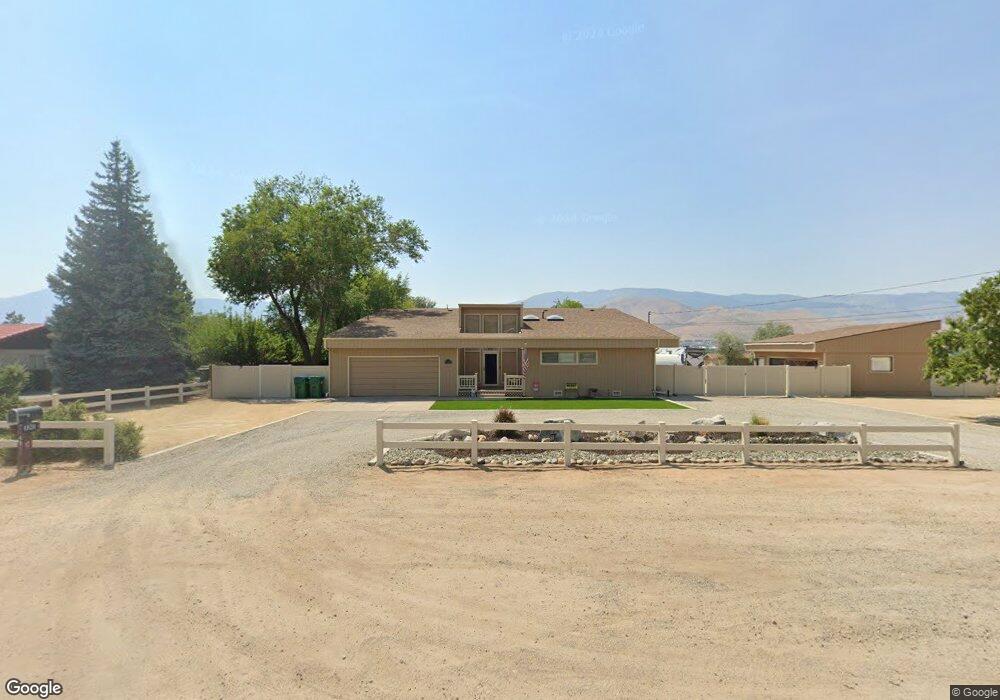
4920 S Edmonds Dr Carson City, NV 89701
Stewart NeighborhoodEstimated Value: $615,462 - $740,000
About This Home
This home is located at 4920 S Edmonds Dr, Carson City, NV 89701 and is currently estimated at $683,616, approximately $362 per square foot. 4920 S Edmonds Dr is a home located in Carson City with nearby schools including Al Seeliger Elementary School, Eagle Valley Middle School, and Carson High School.
Ownership History
We collect this data history from publicly available records. To have your information removed, we recommend requesting removal directly through your county’s website.
Purchase Details
Purchase Details
Home Financials for this Owner
Home Financials are based on the most recent Mortgage that was taken out on this home.Purchase Details
Home Financials for this Owner
Home Financials are based on the most recent Mortgage that was taken out on this home.Purchase Details
Home Values in the Area
Average Home Value in this Area
Purchase History
We collect this data history from publicly available records. To have your information removed, we recommend requesting removal directly through your county’s website.
| Date | Buyer | Sale Price | Title Company |
|---|---|---|---|
| -- | None Listed On Document | ||
| -- | -- | ||
| -- | Western Title Company | ||
| -- | None Available |
Mortgage History
We collect this data history from publicly available records. To have your information removed, we recommend requesting removal directly through your county’s website.
| Date | Status | Borrower | Loan Amount |
|---|---|---|---|
| Previous Owner | $200,000 |
Tax History
We collect this data history from publicly available records. To have your information removed, we recommend requesting removal directly through your county’s website.
| Year | Tax Paid | Tax Assessment Tax Assessment Total Assessment is a certain percentage of the fair market value that is determined by local assessors to be the total taxable value of land and additions on the property. | Land | Improvement |
|---|---|---|---|---|
| 2025 | $2,961 | $105,817 | $57,750 | $48,067 |
| 2024 | $2,875 | $107,784 | $57,750 | $50,034 |
| 2023 | $2,547 | $100,957 | $56,000 | $44,957 |
| 2022 | $2,473 | $89,062 | $47,250 | $41,812 |
| 2021 | $2,269 | $79,483 | $42,000 | $37,483 |
| 2019 | $1,935 | $69,360 | $36,750 | $32,610 |
| 2018 | $1,878 | $65,765 | $33,600 | $32,165 |
| 2017 | $1,824 | $65,765 | $32,375 | $33,390 |
| 2016 | $1,778 | $60,572 | $26,950 | $33,622 |
| 2015 | $1,775 | $60,342 | $26,460 | $33,882 |
| 2014 | $1,723 | $51,995 | $19,600 | $32,395 |
Map
- 5180 S Edmonds Dr
- 5500 S Edmonds Dr
- 1239 E Appion Way
- 542 Bayonne Ave
- 1529 Valley View Dr
- 4399 Ponderosa Dr
- 3949 Ponderosa Dr
- 3457 Conte Dr
- 529 Bayonne Ave
- 3329 S Edmonds Dr
- 528 Bayonne Ave
- 514 Bayonne Ave
- 3946 Southpointe Dr
- 4219 Galway Ct
- 801 Koontz Ln
- 968 Kerinne Cir
- 4110 Limerick Ct
- 180 Silver Peak Loop Unit 3
- 6896 Wheeler Peak Dr
- 182 Silver Peak Loop Unit 1
- 4950 S Edmonds Dr
- 4856 S Edmonds Dr
- 5020 S Edmonds Dr
- 4929 S Edmonds Dr
- 4949 S Edmonds Dr
- 4859 S Edmonds Dr
- 4836 S Edmonds Dr
- 5039 S Edmonds Dr
- 5050 S Edmonds Dr
- 4831 S Edmonds Dr
- 2010 Bennett Ave
- 4760 S Edmonds Dr
- 4942 Conte Dr
- 4974 Conte Dr
- 4761 S Edmonds Dr
- 5110 S Edmonds Dr
- 5050 Conte Dr
- 4836 Conte Dr
- 4868 Conte Dr
- 4730 S Edmonds Dr
Ask me questions while you tour the home.