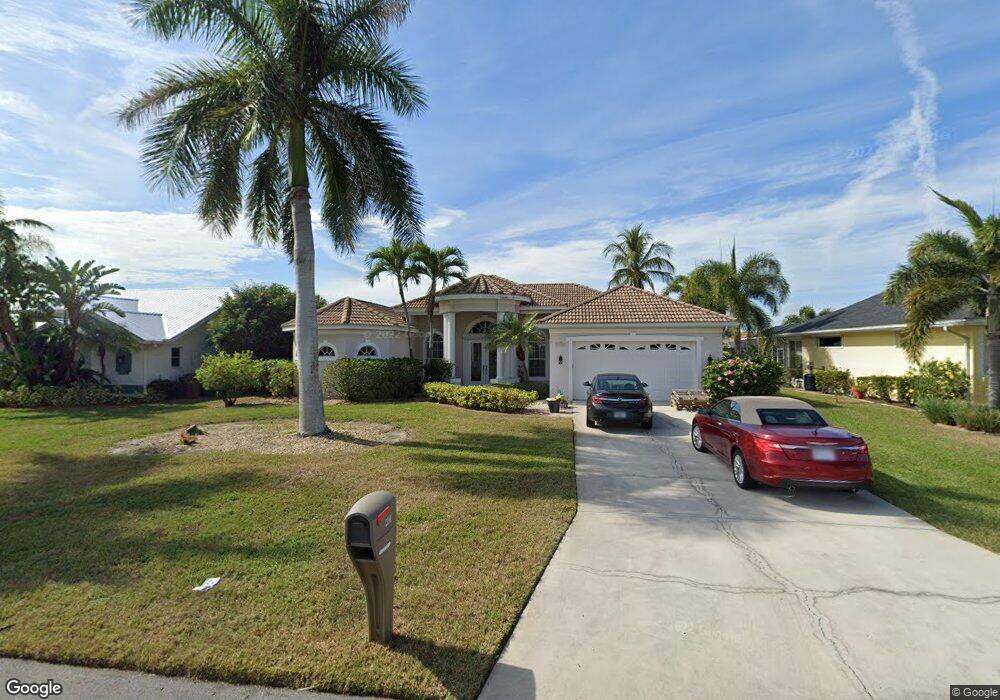
4920 SW 11th Ave Cape Coral, FL 33914
Pelican NeighborhoodEstimated Value: $770,491 - $923,000
3
Beds
3
Baths
3,288
Sq Ft
$256/Sq Ft
Est. Value
About This Home
This home is located at 4920 SW 11th Ave, Cape Coral, FL 33914 and is currently estimated at $843,123, approximately $256 per square foot. 4920 SW 11th Ave is a home located in Lee County with nearby schools including Cape Elementary School, Caloosa Elementary School, and Tropic Isles Elementary School.
Ownership History
Date
Name
Owned For
Owner Type
Purchase Details
Closed on
Mar 1, 2021
Sold by
Piontkowski Gary and Piontkowski Debra
Bought by
Mcqueen Karly and Piontkowski Gary
Current Estimated Value
Home Financials for this Owner
Home Financials are based on the most recent Mortgage that was taken out on this home.
Original Mortgage
$375,000
Interest Rate
2.4%
Mortgage Type
New Conventional
Purchase Details
Closed on
Nov 30, 2004
Sold by
Lacey Charles S and Lacey Sharon W
Bought by
Piontkowski Gary and Piontkowski Debra
Home Financials for this Owner
Home Financials are based on the most recent Mortgage that was taken out on this home.
Original Mortgage
$457,500
Interest Rate
5.67%
Mortgage Type
Stand Alone First
Purchase Details
Closed on
Mar 6, 2001
Sold by
Garland Wanda
Bought by
Lacey Charles S and Lacey Sharon W
Home Financials for this Owner
Home Financials are based on the most recent Mortgage that was taken out on this home.
Original Mortgage
$256,000
Interest Rate
7.09%
Create a Home Valuation Report for This Property
The Home Valuation Report is an in-depth analysis detailing your home's value as well as a comparison with similar homes in the area
Home Values in the Area
Average Home Value in this Area
Purchase History
| Date | Buyer | Sale Price | Title Company |
|---|---|---|---|
| Mcqueen Karly | $100 | None Listed On Document | |
| Piontkowski Gary | $610,000 | Team Title Insurance Inc | |
| Lacey Charles S | $110,000 | -- |
Source: Public Records
Mortgage History
| Date | Status | Borrower | Loan Amount |
|---|---|---|---|
| Previous Owner | Mcqueen Karly | $375,000 | |
| Previous Owner | Piontkowski Gary | $457,500 | |
| Previous Owner | Lacey Charles S | $256,000 |
Source: Public Records
Tax History Compared to Growth
Tax History
| Year | Tax Paid | Tax Assessment Tax Assessment Total Assessment is a certain percentage of the fair market value that is determined by local assessors to be the total taxable value of land and additions on the property. | Land | Improvement |
|---|---|---|---|---|
| 2025 | $11,866 | $740,736 | $411,825 | $280,245 |
| 2024 | $11,866 | $744,898 | $448,300 | $242,629 |
| 2023 | $13,394 | $834,031 | $0 | $0 |
| 2022 | $12,744 | $809,739 | $309,498 | $500,241 |
| 2021 | $9,931 | $536,276 | $237,199 | $299,077 |
| 2020 | $9,427 | $486,926 | $200,000 | $286,926 |
| 2019 | $9,475 | $491,748 | $202,600 | $289,148 |
| 2018 | $9,470 | $496,632 | $193,000 | $303,632 |
| 2017 | $8,679 | $427,960 | $206,000 | $221,960 |
| 2016 | $8,650 | $422,405 | $218,964 | $203,441 |
| 2015 | $8,738 | $424,807 | $192,066 | $232,741 |
| 2014 | -- | $373,909 | $163,612 | $210,297 |
| 2013 | -- | $364,510 | $161,325 | $203,185 |
Source: Public Records
Map
Nearby Homes
- 4912 SW 11th Ave
- 4921 SW 11th Place
- 4904 SW 10th Ave
- 1010 SW 48th Terrace Unit 102
- 1118 SW 48th Terrace Unit 203
- 1124 SW 48th Terrace Unit 208
- 1123 SW 48th Terrace Unit 103
- 3813 SW 11th Ct
- 912 SW 48th Terrace Unit 107
- 1203 SW 48th Terrace Unit 202
- 1203 SW 48th Terrace Unit 201
- 1105 Cape Coral Pkwy W
- 1221 SW 49th St
- 1113 Cape Coral Pkwy W Unit 103
- 902 SW 48th Terrace Unit 105
- 1012 SW 51st Terrace
- 4909 SW 8th Ct
- 1004 SW 51st Terrace
- 1223 SW 51st St
- 921 SW 51st Terrace
- 4924 SW 11th Ave
- 4916 SW 11th Ave
- 4928 SW 11th Ave
- 4912 SW 11th Ave Unit 64
- 4921 SW 11th Ave
- 4917 SW 11th Ave
- 4925 SW 11th Place Unit 64
- 4917 SW 11th Place
- 4932 SW 11th Ave
- 4929 SW 11th Ave
- 4913 SW 11th Ave
- 4908 SW 11th Ave
- 4929 SW 11th Place
- 4913 SW 11th Place
- 4933 SW 11th Ave
- 4909 SW 11th Ave
- 4933 SW 11th Place
- 4909 SW 11th Place
- 4937 SW 11th Ave
- 4937 SW 11th Place