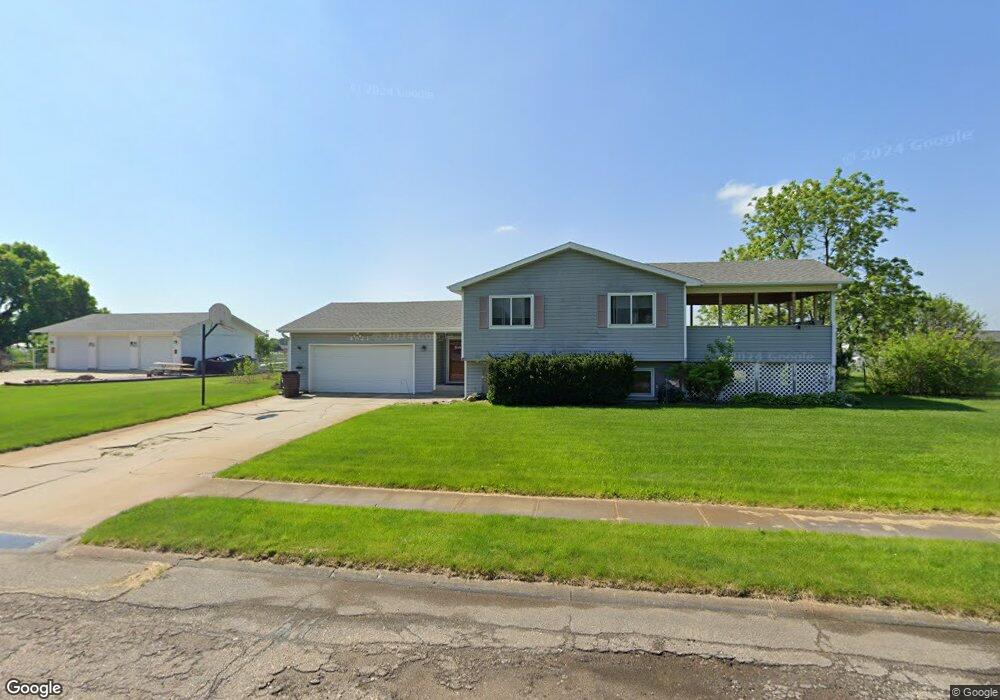
4921 32nd St Columbus, NE 68601
Estimated Value: $183,000 - $297,000
--
Bed
2
Baths
984
Sq Ft
$234/Sq Ft
Est. Value
About This Home
This home is located at 4921 32nd St, Columbus, NE 68601 and is currently estimated at $230,566, approximately $234 per square foot. 4921 32nd St is a home located in Platte County with nearby schools including Lost Creek Elementary School, Columbus Middle School, and Columbus High School.
Ownership History
Date
Name
Owned For
Owner Type
Purchase Details
Closed on
Sep 16, 2025
Sold by
Home Heroes Llc
Bought by
Cbof Llc
Current Estimated Value
Home Financials for this Owner
Home Financials are based on the most recent Mortgage that was taken out on this home.
Original Mortgage
$248,000
Outstanding Balance
$248,000
Interest Rate
6.58%
Mortgage Type
Credit Line Revolving
Estimated Equity
-$17,434
Purchase Details
Closed on
May 7, 2025
Sold by
Pearsoll Julie and Pearsoll Julieann Kay
Bought by
Home Heroes Llc
Purchase Details
Closed on
Oct 25, 2019
Sold by
Pearsoll Dean T
Bought by
Pearsoll Juhe
Purchase Details
Closed on
Jan 4, 2017
Sold by
Pearsoll Dean T
Bought by
Julieann Pearsoll Dean T and Julieann Pearoll
Create a Home Valuation Report for This Property
The Home Valuation Report is an in-depth analysis detailing your home's value as well as a comparison with similar homes in the area
Home Values in the Area
Average Home Value in this Area
Purchase History
| Date | Buyer | Sale Price | Title Company |
|---|---|---|---|
| Cbof Llc | -- | None Listed On Document | |
| Home Heroes Llc | $185,000 | Platinum Title | |
| Home Heroes Llc | $185,000 | Platinum Title | |
| Pearsoll Juhe | -- | None Available | |
| Fuchs Jenifer R | -- | None Available | |
| Julieann Pearsoll Dean T | -- | None Available |
Source: Public Records
Mortgage History
| Date | Status | Borrower | Loan Amount |
|---|---|---|---|
| Open | Cbof Llc | $248,000 |
Source: Public Records
Tax History Compared to Growth
Tax History
| Year | Tax Paid | Tax Assessment Tax Assessment Total Assessment is a certain percentage of the fair market value that is determined by local assessors to be the total taxable value of land and additions on the property. | Land | Improvement |
|---|---|---|---|---|
| 2025 | $3,623 | $273,140 | $38,200 | $234,940 |
| 2024 | $3,623 | $271,845 | $38,200 | $233,645 |
| 2023 | $3,586 | $209,315 | $38,200 | $171,115 |
| 2022 | $3,688 | $206,830 | $38,200 | $168,630 |
| 2021 | $3,341 | $188,010 | $27,000 | $161,010 |
| 2020 | $3,186 | $175,645 | $27,000 | $148,645 |
| 2019 | $2,939 | $164,200 | $27,000 | $137,200 |
| 2018 | $3,017 | $164,200 | $27,000 | $137,200 |
| 2017 | $2,831 | $155,755 | $27,000 | $128,755 |
| 2016 | $2,848 | $155,755 | $27,000 | $128,755 |
| 2015 | $2,622 | $142,065 | $25,000 | $117,065 |
| 2014 | $2,679 | $142,065 | $25,000 | $117,065 |
| 2012 | -- | $142,065 | $25,000 | $117,065 |
Source: Public Records
Map
Nearby Homes