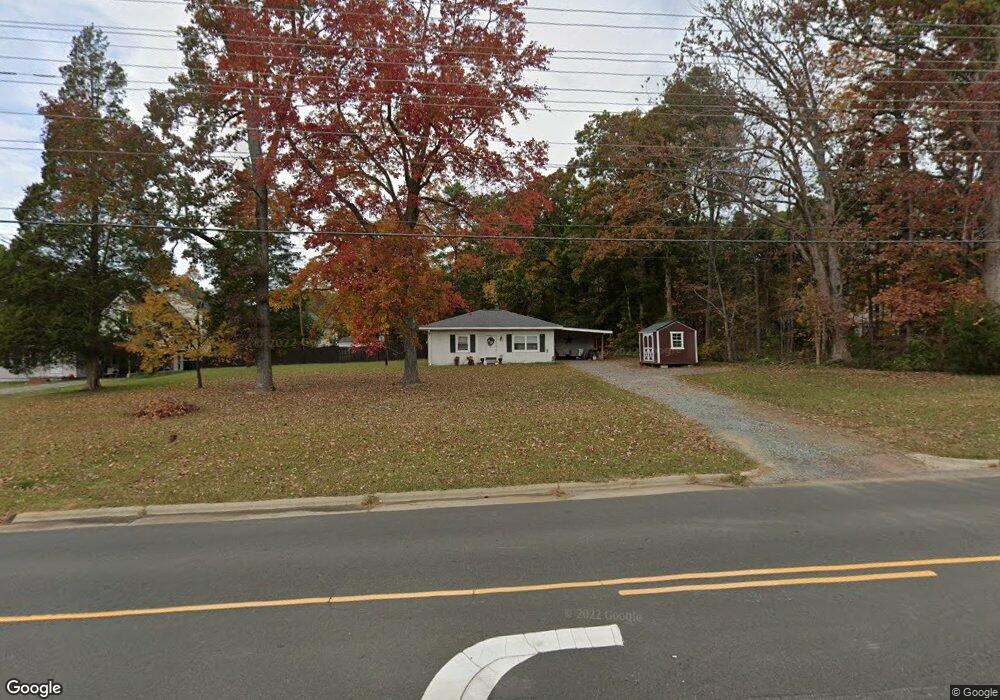
4921 Lumley Rd Durham, NC 27703
Estimated Value: $221,105 - $381,000
2
Beds
1
Bath
884
Sq Ft
$329/Sq Ft
Est. Value
About This Home
This home is located at 4921 Lumley Rd, Durham, NC 27703 and is currently estimated at $290,776, approximately $328 per square foot. 4921 Lumley Rd is a home located in Durham County with nearby schools including Bethesda Elementary School, John W Neal Middle School, and Southern School of Energy & Sustainability.
Ownership History
Date
Name
Owned For
Owner Type
Purchase Details
Closed on
Jan 22, 2004
Sold by
Brinkley Melvin W and Brinkley Shirley N
Bought by
Brinkley Dwight W
Current Estimated Value
Create a Home Valuation Report for This Property
The Home Valuation Report is an in-depth analysis detailing your home's value as well as a comparison with similar homes in the area
Home Values in the Area
Average Home Value in this Area
Purchase History
| Date | Buyer | Sale Price | Title Company |
|---|---|---|---|
| Brinkley Dwight W | -- | -- |
Source: Public Records
Tax History Compared to Growth
Tax History
| Year | Tax Paid | Tax Assessment Tax Assessment Total Assessment is a certain percentage of the fair market value that is determined by local assessors to be the total taxable value of land and additions on the property. | Land | Improvement |
|---|---|---|---|---|
| 2025 | $1,399 | $215,238 | $102,750 | $112,488 |
| 2024 | $1,399 | $100,306 | $27,380 | $72,926 |
| 2023 | $1,314 | $100,306 | $27,380 | $72,926 |
| 2022 | $1,284 | $100,306 | $27,380 | $72,926 |
| 2021 | $1,278 | $100,306 | $27,380 | $72,926 |
| 2020 | $1,248 | $100,306 | $27,380 | $72,926 |
| 2019 | $1,248 | $100,306 | $27,380 | $72,926 |
| 2018 | $1,136 | $83,720 | $30,802 | $52,918 |
| 2017 | $1,127 | $83,720 | $30,802 | $52,918 |
| 2016 | $1,089 | $83,720 | $30,802 | $52,918 |
| 2015 | $1,137 | $82,142 | $32,777 | $49,365 |
| 2014 | $1,137 | $82,142 | $32,777 | $49,365 |
Source: Public Records
Map
Nearby Homes
- 2701 Skybrook Ln
- 2811 Skybrook Ln
- 5014 Rolling Meadows Dr
- 2905 Scuppernong Ln
- 3610 Long Ridge Rd
- 3602 Appling Way
- 2228 Cedar Grove Dr
- 2214 Tw Alexander Dr
- 2709 Hamilton Green Dr
- 342 Westgrove Ct
- 5411 Suda Dr
- 6137 Lakefront St
- 107 Vickery Hill Ct
- 5226 Malik Dr
- 5225 Dilbagh Dr
- 5216 Dilbagh Dr
- 111 Lang St
- 227 Westgrove Ct
- 1130 Bacchanal Ln
- 1130 Bacchanal Ln Unit 19
- 4915 Lumley Rd
- 2647 Oleander Dr
- 2645 Oleander Dr
- 4922 Lumley Rd
- 4918 Lumley Rd
- 3225 Appling Way
- 3303 Forest Grove Ct
- 3305 Forest Grove Ct
- 4916 Lumley Rd
- 2643 Oleander Dr
- 3305 Appling Way
- 2644 Oleander Dr
- 3221 Appling Way
- 3307 Forest Grove Ct
- 2642 Oleander Dr
- 5100 Huxey Glenn Ct
- 2641 Oleander Dr
- 4910 Lumley Rd
- 3309 Forest Grove Ct
- 2640 Oleander Dr