Estimated Value: $419,000 - $433,322
5
Beds
2
Baths
2,016
Sq Ft
$211/Sq Ft
Est. Value
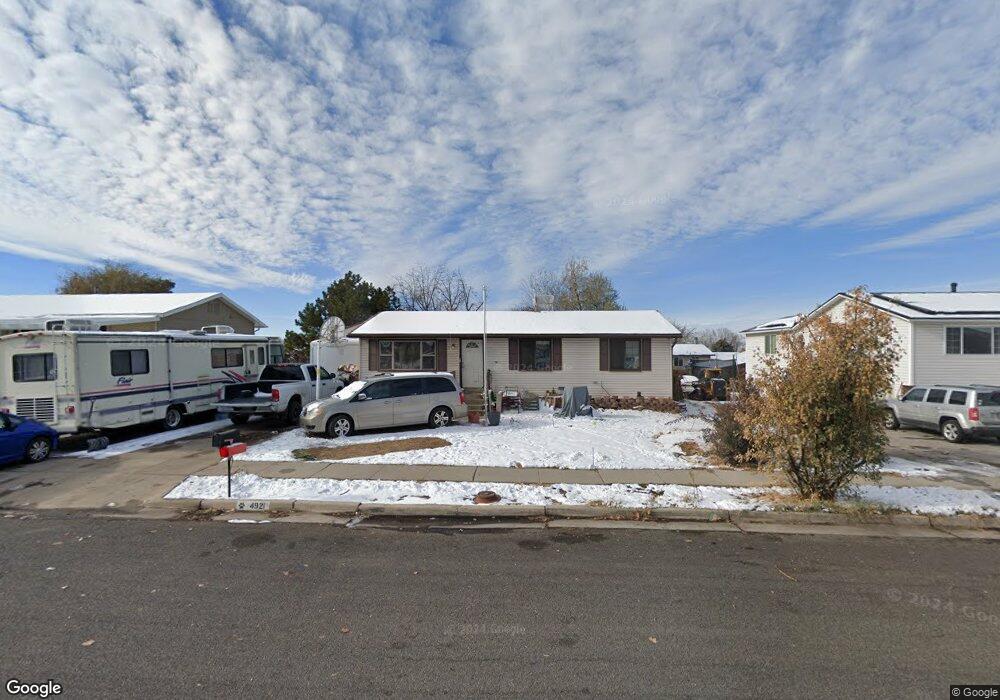
About This Home
This home is located at 4921 S 2825 W, Roy, UT 84067 and is currently estimated at $425,081, approximately $210 per square foot. 4921 S 2825 W is a home located in Weber County with nearby schools including Midland School, Sand Ridge Junior High School, and Roy High School.
Ownership History
Date
Name
Owned For
Owner Type
Purchase Details
Closed on
Apr 24, 2009
Sold by
Collins David P
Bought by
Collins David P and Collins Mary Kathleen
Current Estimated Value
Home Financials for this Owner
Home Financials are based on the most recent Mortgage that was taken out on this home.
Original Mortgage
$180,974
Outstanding Balance
$112,725
Interest Rate
4.99%
Mortgage Type
FHA
Estimated Equity
$312,356
Purchase Details
Closed on
Aug 26, 2008
Sold by
Finster Thomas M and Finster Annette R
Bought by
Collins David P
Home Financials for this Owner
Home Financials are based on the most recent Mortgage that was taken out on this home.
Original Mortgage
$178,346
Interest Rate
6.27%
Mortgage Type
FHA
Purchase Details
Closed on
Aug 25, 2008
Sold by
Collins David P
Bought by
Collins David P and Collins Mary Kathleen
Home Financials for this Owner
Home Financials are based on the most recent Mortgage that was taken out on this home.
Original Mortgage
$178,346
Interest Rate
6.27%
Mortgage Type
FHA
Create a Home Valuation Report for This Property
The Home Valuation Report is an in-depth analysis detailing your home's value as well as a comparison with similar homes in the area
Home Values in the Area
Average Home Value in this Area
Purchase History
| Date | Buyer | Sale Price | Title Company |
|---|---|---|---|
| Collins David P | -- | Us Title Insurance Agency | |
| Collins David P | -- | Us Title Insurance Agency | |
| Collins David P | -- | Equity Title Production Faci | |
| Collins David P | -- | Mountain View Title Ogden |
Source: Public Records
Mortgage History
| Date | Status | Borrower | Loan Amount |
|---|---|---|---|
| Open | Collins David P | $180,974 | |
| Closed | Collins David P | $178,346 |
Source: Public Records
Tax History
| Year | Tax Paid | Tax Assessment Tax Assessment Total Assessment is a certain percentage of the fair market value that is determined by local assessors to be the total taxable value of land and additions on the property. | Land | Improvement |
|---|---|---|---|---|
| 2025 | $2,582 | $408,748 | $131,826 | $276,922 |
| 2024 | $2,476 | $216,698 | $72,504 | $144,194 |
| 2023 | $2,178 | $188,651 | $66,315 | $122,336 |
| 2022 | $2,567 | $233,200 | $55,604 | $177,596 |
| 2021 | $2,028 | $300,999 | $75,808 | $225,191 |
| 2020 | $1,927 | $263,000 | $75,808 | $187,192 |
| 2019 | $1,834 | $235,000 | $45,669 | $189,331 |
| 2018 | $1,825 | $221,000 | $45,669 | $175,331 |
| 2017 | $1,627 | $183,001 | $45,669 | $137,332 |
| 2016 | $1,524 | $91,734 | $22,192 | $69,542 |
| 2015 | $1,448 | $89,343 | $22,192 | $67,151 |
| 2014 | $1,461 | $89,343 | $22,192 | $67,151 |
Source: Public Records
Map
Nearby Homes
- 4891 S 2875 W
- 5009 S 2925 W
- 5063 S 2825 W
- 4793 S 3025 W
- 3022 W 4750 S
- 5141 S 2975 W
- 2953 W 4650 S
- 5125 S 2600 W
- 5155 S 3200 W
- 2568 W 5225 S
- 2602 W 4600 S
- 4881 S 2400 W
- 5321 S 3100 W
- 5421 S 2775 W
- 4374 S 2900 W
- 3443 W 5200 S Unit 2&3
- 2815 W 4275 S
- 3509 W 4835 S Unit 26
- 4491 Haven Creek Rd Unit A
- 3517 W 4835 S Unit 27
Your Personal Tour Guide
Ask me questions while you tour the home.