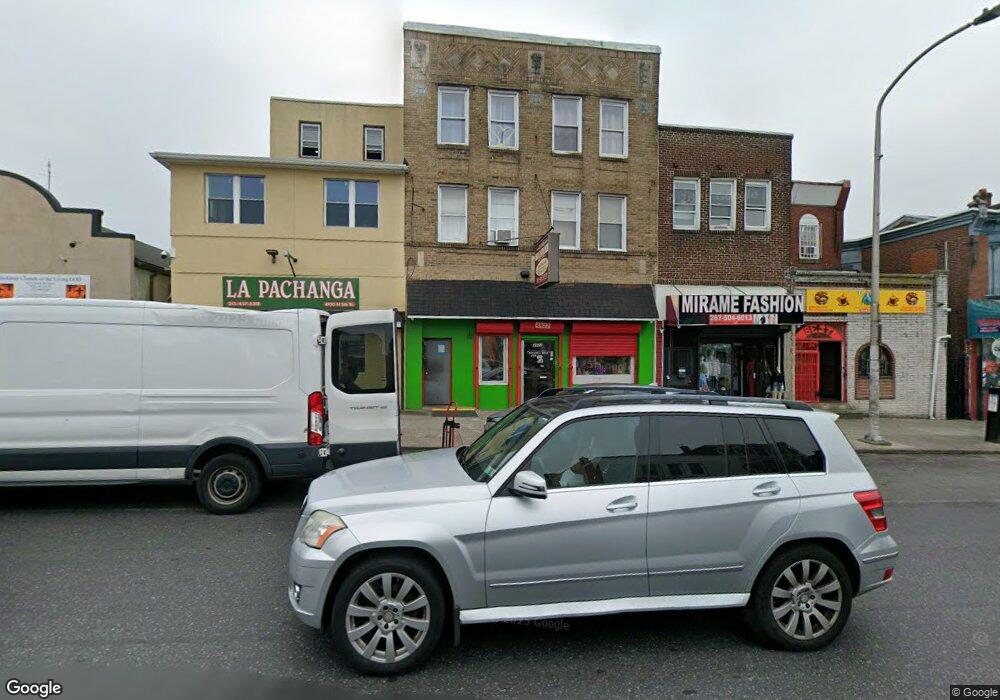
4922 N 5th St Philadelphia, PA 19120
Olney NeighborhoodEstimated Value: $432,502
--
Bed
2
Baths
3,858
Sq Ft
$112/Sq Ft
Est. Value
About This Home
This home is located at 4922 N 5th St, Philadelphia, PA 19120 and is currently estimated at $432,502, approximately $112 per square foot. 4922 N 5th St is a home located in Philadelphia County with nearby schools including Thurgood Marshall School, Birney Preparatory Academy, and Esperanza Cyber Charter School.
Ownership History
Date
Name
Owned For
Owner Type
Purchase Details
Closed on
Aug 25, 2021
Sold by
Karline Venord
Bought by
Zhang Wenjin
Current Estimated Value
Home Financials for this Owner
Home Financials are based on the most recent Mortgage that was taken out on this home.
Original Mortgage
$235,000
Interest Rate
2.98%
Mortgage Type
New Conventional
Purchase Details
Closed on
Mar 20, 2017
Sold by
Venord Seide
Bought by
Venord Karline
Purchase Details
Closed on
Feb 25, 2013
Sold by
Venord Seide and Venord Jean
Bought by
Venord Side
Purchase Details
Closed on
Sep 17, 2010
Sold by
Vernord Marie
Bought by
Venord Siede and Venord Jean
Purchase Details
Closed on
Mar 15, 1995
Sold by
Campos Jose
Bought by
Venord Seide and Venord Marie
Purchase Details
Closed on
Nov 23, 1994
Sold by
Lopes Ilidio and Lopes Olga
Bought by
Defigueiredo Horacio
Purchase Details
Closed on
Sep 28, 1992
Sold by
Green John D
Bought by
Campos Jose
Create a Home Valuation Report for This Property
The Home Valuation Report is an in-depth analysis detailing your home's value as well as a comparison with similar homes in the area
Home Values in the Area
Average Home Value in this Area
Purchase History
| Date | Buyer | Sale Price | Title Company |
|---|---|---|---|
| Zhang Wenjin | $350,000 | None Listed On Document | |
| Venord Karline | -- | None Available | |
| Venord Side | -- | None Available | |
| Venord Siede | -- | None Available | |
| Venord Seide | $100,000 | -- | |
| Defigueiredo Horacio | $90,000 | -- | |
| Campos Jose | $20,500 | -- |
Source: Public Records
Mortgage History
| Date | Status | Borrower | Loan Amount |
|---|---|---|---|
| Previous Owner | Zhang Wenjin | $235,000 |
Source: Public Records
Tax History Compared to Growth
Tax History
| Year | Tax Paid | Tax Assessment Tax Assessment Total Assessment is a certain percentage of the fair market value that is determined by local assessors to be the total taxable value of land and additions on the property. | Land | Improvement |
|---|---|---|---|---|
| 2025 | $2,685 | $293,200 | $58,640 | $234,560 |
| 2024 | $2,685 | $293,200 | $58,640 | $234,560 |
| 2023 | $2,685 | $191,800 | $38,360 | $153,440 |
| 2022 | $3,042 | $191,800 | $38,360 | $153,440 |
| 2021 | $3,088 | $0 | $0 | $0 |
| 2020 | $3,088 | $220,600 | $44,120 | $176,480 |
| 2019 | $3,059 | $0 | $0 | $0 |
| 2018 | $3,211 | $0 | $0 | $0 |
| 2017 | $3,241 | $0 | $0 | $0 |
| 2016 | $3,241 | $0 | $0 | $0 |
| 2015 | $3,102 | $0 | $0 | $0 |
| 2014 | -- | $231,500 | $58,400 | $173,100 |
| 2012 | -- | $23,360 | $7,008 | $16,352 |
Source: Public Records
Map
Nearby Homes
- 4937 N 5th St
- 542 W Rockland St
- 638 W Rockland St
- 5010 N 5th St
- 515-17 W Ruscomb St
- 2511 N Leithgow St
- 429 W Ashdale St
- 437 W Roosevelt Blvd
- 5041 N 6th St
- 0 Lindley Ave
- 194 W Roosevelt Blvd
- 5111 N Fairhill St
- 5112 N Fairhill St
- 4829 N 7th St
- 4815 N 7th St
- 313 Lindley Ave
- 5134 N Fairhill St
- 4804 N 7th St
- 5016 N Franklin St
- 5149 N Fairhill St
- 4918 N 5th St Unit COMMER
- 4918 N 5th St
- 4928 N 5th St
- 4914 N 5th St Unit 5
- 4921 N Fairhill St Unit 23
- 4925 N Fairhill St
- 4927 N Fairhill St Unit 31
- 4909 N Fairhill St Unit 15
- 4917 19 N Fairhill St
- 4902 N 5th St
- 4902-10 N 5th St
- 4933 N Fairhill St
- 4935 N Fairhill St
- 4940 N 5th St
- 4925 N 5th St
- 4927 N 5th St
- 4929 N 5th St
- 4937 N Fairhill St
- 4942 N 5th St Unit 1
- 4942 N 5th St