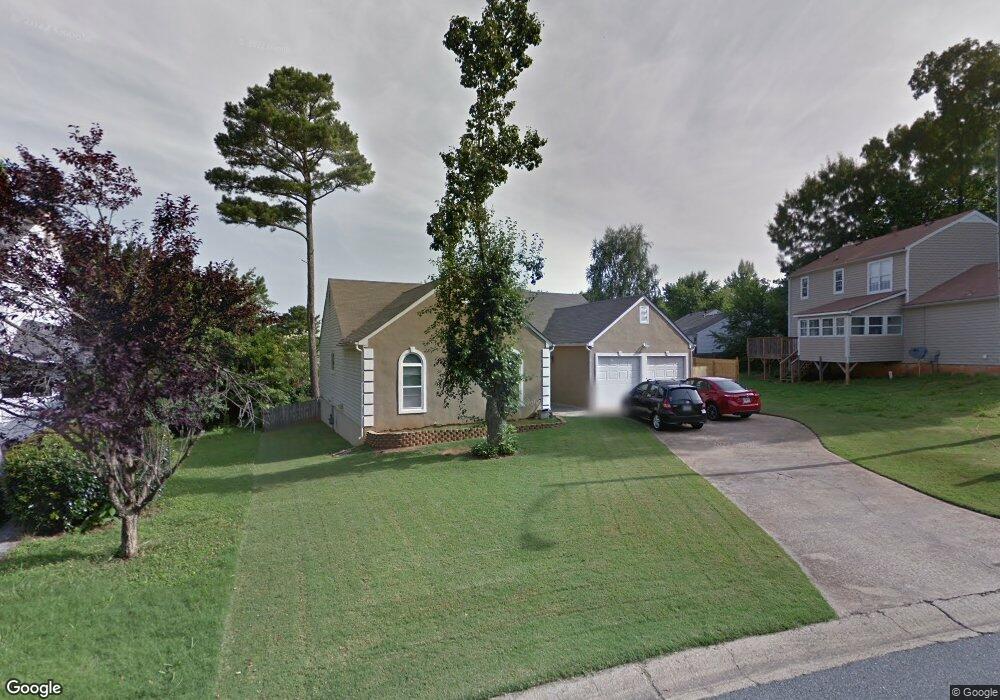
4923 October Way NW Acworth, GA 30102
Estimated Value: $329,000 - $359,000
3
Beds
2
Baths
1,734
Sq Ft
$196/Sq Ft
Est. Value
About This Home
This home is located at 4923 October Way NW, Acworth, GA 30102 and is currently estimated at $339,037, approximately $195 per square foot. 4923 October Way NW is a home located in Cobb County with nearby schools including Pitner Elementary School, Palmer Middle School, and North Cobb High School.
Ownership History
Date
Name
Owned For
Owner Type
Purchase Details
Closed on
Sep 30, 2010
Sold by
Akin Andrew S
Bought by
Koo Alexis R
Current Estimated Value
Home Financials for this Owner
Home Financials are based on the most recent Mortgage that was taken out on this home.
Original Mortgage
$120,143
Outstanding Balance
$79,052
Interest Rate
4.37%
Mortgage Type
FHA
Estimated Equity
$259,985
Purchase Details
Closed on
Mar 13, 2002
Sold by
Pierre Patricia and Pierre Michelaine
Bought by
Cobb October Way Pierre Family
Purchase Details
Closed on
Jun 17, 1999
Sold by
Mugg Marsha R
Bought by
Pierre Patricia and Pierre Michelaine
Home Financials for this Owner
Home Financials are based on the most recent Mortgage that was taken out on this home.
Original Mortgage
$111,900
Interest Rate
7.13%
Mortgage Type
FHA
Purchase Details
Closed on
Jan 31, 1996
Sold by
Walters William T Tra
Bought by
Mugg Marsha R
Create a Home Valuation Report for This Property
The Home Valuation Report is an in-depth analysis detailing your home's value as well as a comparison with similar homes in the area
Home Values in the Area
Average Home Value in this Area
Purchase History
| Date | Buyer | Sale Price | Title Company |
|---|---|---|---|
| Koo Alexis R | $125,300 | -- | |
| Cobb October Way Pierre Family | $12,600 | -- | |
| Pierre Patricia | $112,000 | -- | |
| Mugg Marsha R | $96,900 | -- |
Source: Public Records
Mortgage History
| Date | Status | Borrower | Loan Amount |
|---|---|---|---|
| Open | Koo Alexis R | $120,143 | |
| Previous Owner | Pierre Patricia | $111,900 | |
| Closed | Mugg Marsha R | $0 |
Source: Public Records
Tax History Compared to Growth
Tax History
| Year | Tax Paid | Tax Assessment Tax Assessment Total Assessment is a certain percentage of the fair market value that is determined by local assessors to be the total taxable value of land and additions on the property. | Land | Improvement |
|---|---|---|---|---|
| 2025 | $3,039 | $133,948 | $24,000 | $109,948 |
| 2024 | $3,042 | $133,948 | $24,000 | $109,948 |
| 2023 | $1,761 | $99,920 | $18,000 | $81,920 |
| 2022 | $2,322 | $99,920 | $18,000 | $81,920 |
| 2021 | $1,688 | $70,960 | $18,000 | $52,960 |
| 2020 | $1,688 | $70,960 | $18,000 | $52,960 |
| 2019 | $1,576 | $65,844 | $12,000 | $53,844 |
| 2018 | $1,576 | $65,844 | $12,000 | $53,844 |
| 2017 | $1,212 | $51,940 | $10,000 | $41,940 |
| 2016 | $1,213 | $51,940 | $10,000 | $41,940 |
| 2015 | $1,142 | $47,600 | $10,000 | $37,600 |
| 2014 | $671 | $31,432 | $0 | $0 |
Source: Public Records
Map
Nearby Homes
- 1994 Morning Walk NW
- 1996 Morning Walk NW
- 0 Hamby Rd Unit 10651084
- 0 Hamby Rd Unit 7686326
- 5018 Amber Way NW Unit 2
- 4903 Wilkie Way NW
- 2138 Hamby Cove Dr NW
- 4912 Lightwood Ct NW
- 1824 Lightwood Ln NW
- 1800 Baynard Ct NW
- 1908 Hamby Place Dr NW
- 1964 Tranquil Field Way NW
- 1833 Hickory Creek Ct NW
- 1865 Hickory Creek Ct NW
- 1839 Tranquil Field Dr NW
- 1924 Paddock Path Dr NW
- 1821 Hickory Creek Ct NW
- 4925 October Way NW
- 4925 October Way NW Unit 4925
- 4921 October Way NW
- 1969 Morning Ln NW
- 1969 Morning Walk NW
- 1967 Morning Ln NW
- 1967 Morning Walk NW Unit 6
- 4919 October Way NW
- 1968 Morning Ln NW
- 4924 October Way NW
- 4918 October Way NW
- 1965 Morning Ln NW
- 4917 October Way NW
- 1972 Morning Walk NW Unit 3
- 1970 Morning Walk NW
- 1968 Morning Walk NW Unit 6
- 1965 Morning Walk NW
- 1977 Morning Walk NW
- 1966 Morning Ln NW
- 1974 Morning Walk NW Unit 10