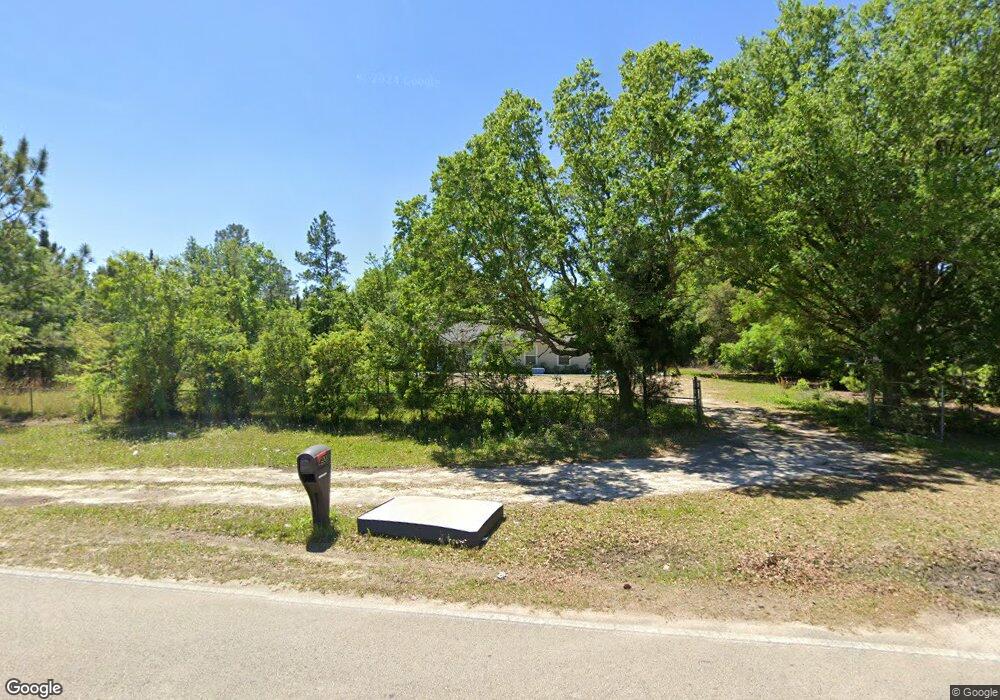
4923 Peppergrass St Middleburg, FL 32068
Estimated Value: $335,000 - $369,000
3
Beds
2
Baths
1,621
Sq Ft
$219/Sq Ft
Est. Value
About This Home
This home is located at 4923 Peppergrass St, Middleburg, FL 32068 and is currently estimated at $355,094, approximately $219 per square foot. 4923 Peppergrass St is a home located in Clay County with nearby schools including J.L. Wilkinson Elementary School, Middleburg High School, and Wilkinson Junior High School.
Ownership History
Date
Name
Owned For
Owner Type
Purchase Details
Closed on
May 8, 2020
Sold by
Cosmos Nursery And Tree Center Inc
Bought by
Hall Howard
Current Estimated Value
Home Financials for this Owner
Home Financials are based on the most recent Mortgage that was taken out on this home.
Original Mortgage
$250,381
Outstanding Balance
$220,357
Interest Rate
3.4%
Mortgage Type
New Conventional
Estimated Equity
$134,737
Purchase Details
Closed on
Apr 1, 2020
Sold by
Tennant Stephanei
Bought by
Sarimento Ramiro Moncayo and Delacruz Aracely Hernandez
Home Financials for this Owner
Home Financials are based on the most recent Mortgage that was taken out on this home.
Original Mortgage
$250,381
Outstanding Balance
$220,357
Interest Rate
3.4%
Mortgage Type
New Conventional
Estimated Equity
$134,737
Purchase Details
Closed on
Aug 26, 2019
Sold by
Williams David A and Williams Rita N
Bought by
Tennant Stephanie
Purchase Details
Closed on
Jul 1, 2017
Bought by
Williams David A and Williams Rita N
Create a Home Valuation Report for This Property
The Home Valuation Report is an in-depth analysis detailing your home's value as well as a comparison with similar homes in the area
Home Values in the Area
Average Home Value in this Area
Purchase History
| Date | Buyer | Sale Price | Title Company |
|---|---|---|---|
| Hall Howard | -- | Attorney | |
| Sarimento Ramiro Moncayo | $255,000 | Realty Title Inc | |
| Tennant Stephanie | $32,000 | Americas Title Corp | |
| Williams David A | $100 | -- |
Source: Public Records
Mortgage History
| Date | Status | Borrower | Loan Amount |
|---|---|---|---|
| Open | Sarimento Ramiro Moncayo | $250,381 |
Source: Public Records
Tax History
| Year | Tax Paid | Tax Assessment Tax Assessment Total Assessment is a certain percentage of the fair market value that is determined by local assessors to be the total taxable value of land and additions on the property. | Land | Improvement |
|---|---|---|---|---|
| 2025 | $3,489 | $279,903 | -- | -- |
| 2024 | $3,735 | $272,015 | -- | -- |
| 2023 | $3,735 | $264,093 | $0 | $0 |
| 2022 | $3,512 | $256,401 | $25,000 | $231,401 |
| 2021 | $3,570 | $214,585 | $17,000 | $197,585 |
| 2020 | $571 | $37,518 | $34,000 | $3,518 |
| 2019 | $333 | $21,666 | $18,000 | $3,666 |
| 2018 | $579 | $39,851 | $0 | $0 |
| 2017 | $592 | $39,999 | $0 | $0 |
| 2016 | $821 | $54,166 | $0 | $0 |
| 2015 | $138 | $8,912 | $0 | $0 |
| 2014 | $143 | $9,036 | $0 | $0 |
Source: Public Records
Map
Nearby Homes
- 2153 Hibiscus Ave
- 4938 Basil St
- 2223 Cosmos Ave
- 4939 Basil St
- 4990 Laurel St
- 2309 Indigo Ave
- 2171 Cosmos Ave
- 2226 S Cocoa Ave
- 4948 Alfalfa St
- 4818 Acacia St
- 5171 Antler Trail
- 4860 Fireweed St
- 86 Melanie Ln
- 79 Melanie Ln
- 5175 Carter Spencer Rd
- 125 Currant Ave
- 4493 County Road 218
- 2313 Daisy St
- 2373 Broom Ct
- 2435 Range Line Rd
- 4923 Peppergrass St
- 4905 Peppergrass St
- 2225 Indigo Ave
- 4928 Peppergrass St
- 4895 Peppergrass St
- 2173 Indigo Ave
- 2212 Indigo Ave
- 2198 Indigo Ave
- 2224 Indigo Ave
- 2208 Indigo Ave
- 2233 Indigo Ave
- 2190 Indigo Ave
- 4889 Peppergrass St
- 2182 Indigo Ave
- 4890 Peppergrass St
- 2237 Indigo Ave
- 4843 Mayflower St
- 4871 Mayflower St
- 4950 Flax Ct
- 4851 Mayflower St
Your Personal Tour Guide
Ask me questions while you tour the home.