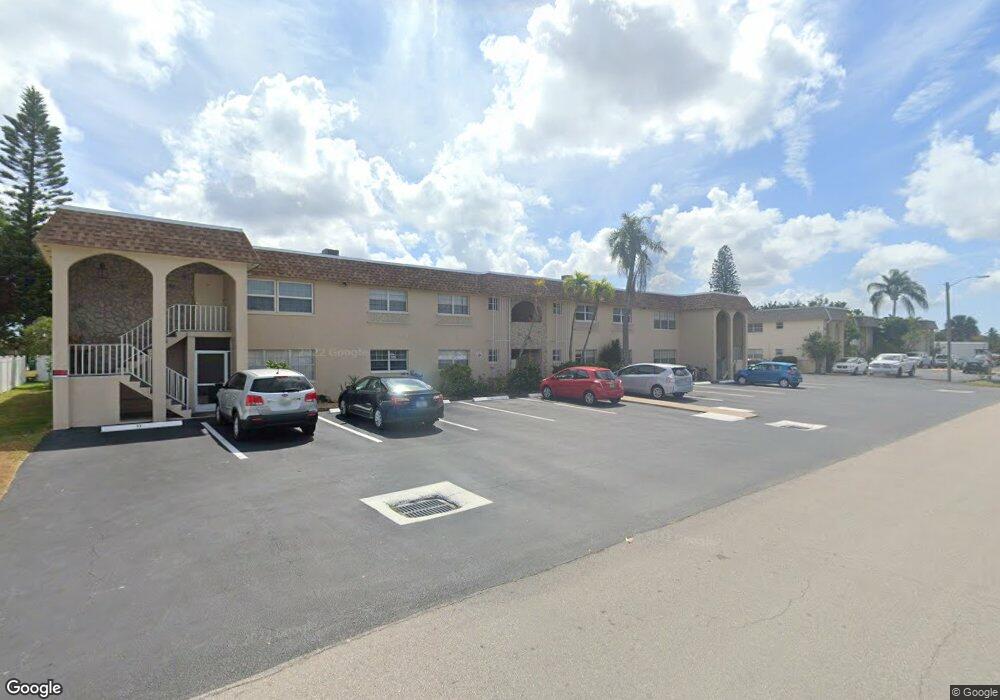
4923 Vincennes Ct Unit 1 Cape Coral, FL 33904
Caloosahatchee NeighborhoodEstimated Value: $100,771 - $145,000
2
Beds
1
Bath
604
Sq Ft
$193/Sq Ft
Est. Value
About This Home
This home is located at 4923 Vincennes Ct Unit 1, Cape Coral, FL 33904 and is currently estimated at $116,693, approximately $193 per square foot. 4923 Vincennes Ct Unit 1 is a home located in Lee County with nearby schools including Cape Elementary School, Caloosa Elementary School, and Tropic Isles Elementary School.
Ownership History
Date
Name
Owned For
Owner Type
Purchase Details
Closed on
Mar 10, 2019
Sold by
Decarlo Peter
Bought by
Ctt Property Group Llc
Current Estimated Value
Purchase Details
Closed on
Oct 31, 2016
Sold by
Bochetti Joseph M
Bought by
Decarlo Peter
Purchase Details
Closed on
May 27, 2014
Sold by
Bochetti Joseph M
Bought by
Bochetti Joseph M and Joseph M Bochetti Family Trust
Purchase Details
Closed on
Jun 10, 2011
Sold by
Fabio Homes Llc Inc
Bought by
Bochetti Joseph M
Purchase Details
Closed on
May 14, 2010
Sold by
Desoto Holdings Inc
Bought by
Fabio Homes Inc
Purchase Details
Closed on
Apr 13, 1999
Sold by
Rubenstein Ann
Bought by
Patat John and Patat Eileen
Home Financials for this Owner
Home Financials are based on the most recent Mortgage that was taken out on this home.
Original Mortgage
$27,900
Interest Rate
7.08%
Create a Home Valuation Report for This Property
The Home Valuation Report is an in-depth analysis detailing your home's value as well as a comparison with similar homes in the area
Home Values in the Area
Average Home Value in this Area
Purchase History
| Date | Buyer | Sale Price | Title Company |
|---|---|---|---|
| Ctt Property Group Llc | -- | Attorney | |
| Decarlo Peter | $60,000 | Ray Breeze Title Services Ll | |
| Bochetti Joseph M | -- | Attorney | |
| Bochetti Joseph M | $28,000 | Bay Breeze Title Services Ll | |
| Fabio Homes Inc | $23,000 | Attorney | |
| Desoto Holdings Inc | $15,000 | Title Specialists Of The Gul | |
| Patat John | $31,000 | -- |
Source: Public Records
Mortgage History
| Date | Status | Borrower | Loan Amount |
|---|---|---|---|
| Previous Owner | Patat John | $27,900 |
Source: Public Records
Tax History Compared to Growth
Tax History
| Year | Tax Paid | Tax Assessment Tax Assessment Total Assessment is a certain percentage of the fair market value that is determined by local assessors to be the total taxable value of land and additions on the property. | Land | Improvement |
|---|---|---|---|---|
| 2025 | $1,522 | $55,922 | -- | -- |
| 2024 | $422 | $50,838 | -- | -- |
| 2023 | $422 | $4,710 | $0 | $4,710 |
| 2022 | $1,066 | $42,015 | $0 | $0 |
| 2021 | $877 | $38,439 | $0 | $38,439 |
| 2020 | $828 | $34,723 | $0 | $34,723 |
| 2019 | $821 | $34,723 | $0 | $34,723 |
| 2018 | $370 | $34,723 | $0 | $34,723 |
| 2017 | $394 | $36,338 | $0 | $36,338 |
| 2016 | $691 | $30,105 | $0 | $30,105 |
| 2015 | $621 | $24,600 | $0 | $24,600 |
| 2014 | -- | $25,100 | $0 | $25,100 |
| 2013 | -- | $20,500 | $0 | $20,500 |
Source: Public Records
Map
Nearby Homes
- 4960 Vincennes St
- 4931 Vincennes Ct Unit 6
- 4931 Vincennes Ct Unit 9
- 4903 Vincennes St Unit 116
- 4912 Vincennes St Unit 101
- 1105, 1113, 1117 Miramar St
- 4904 Vincennes St Unit 201
- 4975 Vincennes St Unit A-B
- 4969 Viceroy St Unit 106
- 4953 Viceroy St
- 4938 Vincennes St Unit 3
- 4938 Vincennes St Unit 4
- 817 Lafayette St
- 819 Lafayette St
- 4928 Vincennes St Unit C3
- 4928 Vincennes St Unit A2
- 4970 Viceroy St
- 1428 Vendome Ct
- 1425 Venetian Ct
- 4938 Viceroy St Unit 107
- 4923 Vincennes Ct Unit 7
- 4923 Vincennes Ct Unit 6
- 4923 Vincennes Ct Unit 3
- 4923 Vincennes Ct Unit 4
- 4923 Vincennes Ct Unit 5
- 4923 Vincennes Ct Unit 10
- 4923 Vincennes Ct Unit 11
- 4923 Vincennes Ct Unit 12
- 4923 Vincennes Ct Unit 9
- 4923 Vincennes Ct Unit 2
- 4923 Vicennes Ct Ct Unit 9
- 4938 Vincennes Ct
- 4960 Vincennes St Unit 1-2
- 4960 Vincennes St Unit 1
- 4964 Vincennes St Unit 102
- 4964 Vincennes St Unit 101
- 4964 Vincennes St Unit 104
- 4964 Vincennes St Unit 7 (107)
- 4964 Vincennes St Unit 103
- 4964 Vincennes St Unit 1-7