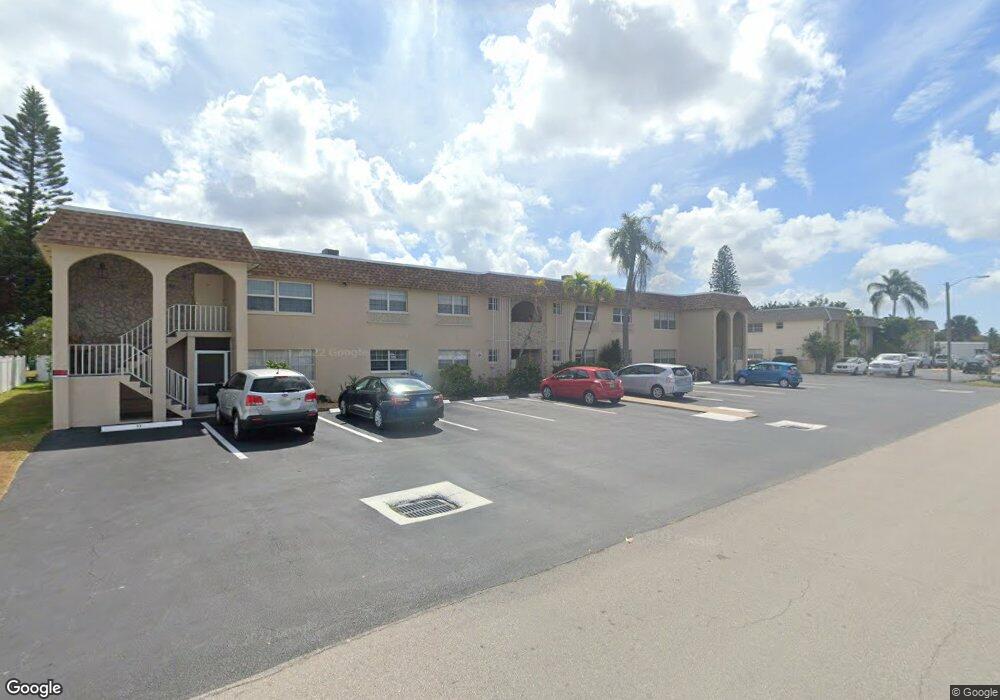
4923 Vincennes Ct Unit 11 Cape Coral, FL 33904
Caloosahatchee NeighborhoodEstimated Value: $125,000 - $171,000
2
Beds
2
Baths
818
Sq Ft
$184/Sq Ft
Est. Value
About This Home
This home is located at 4923 Vincennes Ct Unit 11, Cape Coral, FL 33904 and is currently estimated at $150,504, approximately $183 per square foot. 4923 Vincennes Ct Unit 11 is a home located in Lee County with nearby schools including Cape Elementary School, Caloosa Elementary School, and Tropic Isles Elementary School.
Ownership History
Date
Name
Owned For
Owner Type
Purchase Details
Closed on
May 16, 2025
Sold by
Kent I Condominium Association Inc
Bought by
Fontaine Antonio
Current Estimated Value
Purchase Details
Closed on
May 29, 2007
Sold by
Thornton Beverly R
Bought by
Kent I Condominium Assn Inc
Purchase Details
Closed on
Sep 15, 2005
Sold by
Heppner Andrea
Bought by
Thornton Beverly R
Home Financials for this Owner
Home Financials are based on the most recent Mortgage that was taken out on this home.
Original Mortgage
$109,250
Interest Rate
9.15%
Mortgage Type
Unknown
Purchase Details
Closed on
Feb 6, 2004
Sold by
Benavides Martin
Bought by
Heppner Andrea
Home Financials for this Owner
Home Financials are based on the most recent Mortgage that was taken out on this home.
Original Mortgage
$70,000
Interest Rate
5.63%
Purchase Details
Closed on
Aug 12, 1997
Sold by
Dale James Wesley
Bought by
Benavides Hilario and Benavides Olga P
Home Financials for this Owner
Home Financials are based on the most recent Mortgage that was taken out on this home.
Original Mortgage
$25,900
Interest Rate
7.65%
Create a Home Valuation Report for This Property
The Home Valuation Report is an in-depth analysis detailing your home's value as well as a comparison with similar homes in the area
Home Values in the Area
Average Home Value in this Area
Purchase History
| Date | Buyer | Sale Price | Title Company |
|---|---|---|---|
| Fontaine Antonio | $100 | None Listed On Document | |
| Kent I Condominium Assn Inc | $8,100 | Attorney | |
| Thornton Beverly R | $115,000 | -- | |
| Heppner Andrea | $70,000 | -- | |
| Benavides Hilario | $37,000 | -- |
Source: Public Records
Mortgage History
| Date | Status | Borrower | Loan Amount |
|---|---|---|---|
| Previous Owner | Thornton Beverly R | $109,250 | |
| Previous Owner | Heppner Andrea | $70,000 | |
| Previous Owner | Benavides Hilario | $25,900 |
Source: Public Records
Tax History Compared to Growth
Tax History
| Year | Tax Paid | Tax Assessment Tax Assessment Total Assessment is a certain percentage of the fair market value that is determined by local assessors to be the total taxable value of land and additions on the property. | Land | Improvement |
|---|---|---|---|---|
| 2025 | $1,871 | $78,030 | -- | -- |
| 2024 | $1,871 | $70,936 | -- | -- |
| 2023 | $439 | $4,710 | $0 | $4,710 |
| 2022 | $1,394 | $58,625 | $0 | $0 |
| 2021 | $1,146 | $53,387 | $0 | $53,387 |
| 2020 | $1,084 | $48,450 | $0 | $48,450 |
| 2019 | $1,027 | $48,450 | $0 | $48,450 |
| 2018 | $990 | $48,450 | $0 | $48,450 |
| 2017 | $967 | $50,873 | $0 | $50,873 |
| 2016 | $875 | $42,641 | $0 | $42,641 |
| 2015 | $777 | $33,700 | $0 | $33,700 |
| 2014 | $716 | $34,600 | $0 | $34,600 |
| 2013 | -- | $26,400 | $0 | $26,400 |
Source: Public Records
Map
Nearby Homes
- 4960 Vincennes St
- 4931 Vincennes Ct Unit 6
- 4931 Vincennes Ct Unit 9
- 4903 Vincennes St Unit 116
- 4912 Vincennes St Unit 101
- 1105, 1113, 1117 Miramar St
- 4904 Vincennes St Unit 201
- 4975 Vincennes St Unit A-B
- 4969 Viceroy St Unit 106
- 4953 Viceroy St
- 4938 Vincennes St Unit 3
- 4938 Vincennes St Unit 4
- 817 Lafayette St
- 819 Lafayette St
- 4928 Vincennes St Unit C3
- 4928 Vincennes St Unit A2
- 4970 Viceroy St
- 1428 Vendome Ct
- 1425 Venetian Ct
- 4938 Viceroy St Unit 107
- 4923 Vincennes Ct Unit 7
- 4923 Vincennes Ct Unit 6
- 4923 Vincennes Ct Unit 3
- 4923 Vincennes Ct Unit 4
- 4923 Vincennes Ct Unit 5
- 4923 Vincennes Ct Unit 10
- 4923 Vincennes Ct Unit 12
- 4923 Vincennes Ct Unit 1
- 4923 Vincennes Ct Unit 9
- 4923 Vincennes Ct Unit 2
- 4923 Vicennes Ct Ct Unit 9
- 4938 Vincennes Ct
- 4960 Vincennes St Unit 1-2
- 4960 Vincennes St Unit 1
- 4964 Vincennes St Unit 102
- 4964 Vincennes St Unit 101
- 4964 Vincennes St Unit 104
- 4964 Vincennes St Unit 7 (107)
- 4964 Vincennes St Unit 103
- 4964 Vincennes St Unit 1-7