


4924 Balustrade Blvd SE Lacey, WA 98513
Horizon Pointe NeighborhoodEstimated payment $3,307/month
Highlights
- Walk-In Pantry
- Community Playground
- Forced Air Heating System
- 2 Car Attached Garage
- Bathroom on Main Level
- Partially Fenced Property
About This Home
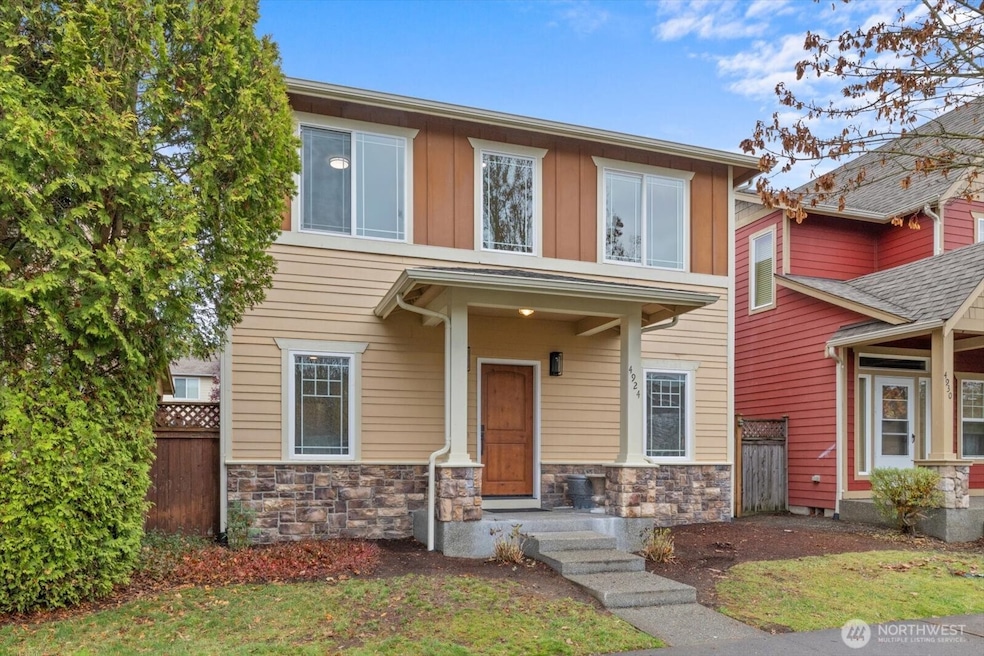
Experience high-quality, turn-key living in this fully updated 2,090 sqft home in Lacey's Horizon Pointe community. Built in 2005, this 3-bed, 2.5-bath residence features an open-concept main floor and durable HardiePlank siding. Updates include new hardwood flooring down, new carpet up, fresh interior paint, and new entry doors. The updated kitchen shines with shaker cabinets, stunning Kohler Taj Mahal quartzite counters, and stainless appliances. The spacious primary suite offers a well-appointed bath w/ double vanity, separate shower, tub, and walk-in closet. All baths are fully renovated! With a fenced backyard, attached 2-car garage, community access to Horizons Park, and just 10 minutes to the freeway, this home is move-in ready.
Source: Northwest Multiple Listing Service (NWMLS)
MLS#: 2455821
Home Details
Home Type
- Single Family
Est. Annual Taxes
- $4,527
Year Built
- Built in 2005
Lot Details
- 3,230 Sq Ft Lot
- Partially Fenced Property
- Level Lot
HOA Fees
- $150 Monthly HOA Fees
Parking
- 2 Car Attached Garage
- Driveway
- Off-Street Parking
Home Design
- Poured Concrete
- Composition Roof
- Cement Board or Planked
Interior Spaces
- 2,090 Sq Ft Home
- 2-Story Property
- Gas Fireplace
- Walk-In Pantry
Flooring
- Carpet
- Laminate
Bedrooms and Bathrooms
- 3 Bedrooms
- Bathroom on Main Level
Schools
- Horizons Elementary School
- Komachin Mid Middle School
- Timberline High School
Utilities
- Forced Air Heating System
Listing and Financial Details
- Down Payment Assistance Available
- Visit Down Payment Resource Website
- Assessor Parcel Number 55290000500
Community Details
Overview
- Association fees include common area maintenance, lawn service
- Horizon Point Lacey Managed By Vis Group Association
- Horizon Pointe Subdivision
- The community has rules related to covenants, conditions, and restrictions
Recreation
- Community Playground
Map
Home Values in the Area
Average Home Value in this Area
Tax History
| Year | Tax Paid | Tax Assessment Tax Assessment Total Assessment is a certain percentage of the fair market value that is determined by local assessors to be the total taxable value of land and additions on the property. | Land | Improvement |
|---|---|---|---|---|
| 2024 | $4,033 | $435,600 | $82,800 | $352,800 |
| 2023 | $4,033 | $421,700 | $69,100 | $352,600 |
| 2022 | $3,749 | $421,200 | $41,100 | $380,100 |
| 2021 | $3,497 | $322,100 | $42,700 | $279,400 |
| 2020 | $3,370 | $279,900 | $51,800 | $228,100 |
| 2019 | $2,831 | $280,200 | $45,900 | $234,300 |
| 2018 | $3,252 | $242,200 | $36,100 | $206,100 |
| 2017 | $2,818 | $221,050 | $36,250 | $184,800 |
| 2016 | $2,616 | $213,000 | $35,100 | $177,900 |
| 2014 | -- | $200,100 | $33,600 | $166,500 |
Property History
| Date | Event | Price | List to Sale | Price per Sq Ft |
|---|---|---|---|---|
| 11/17/2025 11/17/25 | For Sale | $529,000 | -- | $253 / Sq Ft |
Purchase History
| Date | Type | Sale Price | Title Company |
|---|---|---|---|
| Quit Claim Deed | -- | Chicago Title | |
| Trustee Deed | $301,100 | None Listed On Document | |
| Quit Claim Deed | -- | None Listed On Document | |
| Warranty Deed | $259,787 | Chicago Title Company |
Mortgage History
| Date | Status | Loan Amount | Loan Type |
|---|---|---|---|
| Open | $53,875 | Construction | |
| Previous Owner | $281,501 | New Conventional | |
| Previous Owner | $207,900 | Unknown |
Source: Northwest Multiple Listing Service (NWMLS)
MLS Number: 2455821
APN: 55290000500
Disclaimer: Certain information contained herein is derived from information provided by parties other than Homes.com. All information provided is deemed reliable, but is not guaranteed to be accurate and should be independently verified.
![]() All data is obtained from various sources and may not have been verified by broker or MLS GRID. Supplied Open House Information is subject to change without notice. All information should be independently reviewed and verified for accuracy. Properties may or may not be listed by the office/agent presenting the information. Listing information is provided by the Northwest Multiple Listing Service (NWMLS). Property information is based on available data that may include MLS information, county records, and other sources. Listings marked with the 3 tree icon and provided by NWMLS. All properties are subject to prior sale or withdrawal. IDX information is provided exclusively for consumers’ personal noncommercial use, that it may not be used for any purpose other than to identify prospective properties consumers may be interested in purchasing, that the data is deemed reliable but is not guaranteed by MLS GRID. ©2025 NWMLS.
All data is obtained from various sources and may not have been verified by broker or MLS GRID. Supplied Open House Information is subject to change without notice. All information should be independently reviewed and verified for accuracy. Properties may or may not be listed by the office/agent presenting the information. Listing information is provided by the Northwest Multiple Listing Service (NWMLS). Property information is based on available data that may include MLS information, county records, and other sources. Listings marked with the 3 tree icon and provided by NWMLS. All properties are subject to prior sale or withdrawal. IDX information is provided exclusively for consumers’ personal noncommercial use, that it may not be used for any purpose other than to identify prospective properties consumers may be interested in purchasing, that the data is deemed reliable but is not guaranteed by MLS GRID. ©2025 NWMLS.
Based on information submitted to the MLS GRID
- 7009 Wisley Ln SE
- 5002 70th Way SE
- 6611 Millstone Ln SE Unit F101
- 4442 Prestwick Ln SE
- 6974 Prism St SE
- 7074 Inlay St SE
- 6849 Fairway Ln SE
- 7027 Bailey St SE
- 6605 Riviera Ct SE Unit 23B
- 7633 Countrywood Dr SE
- 4120 Stonehaven Ln SE
- 4112 Stonehaven Ln SE
- 5532 Mountain Green Ln SE
- 5514 Asotin Ln SE
- 6531 Indiana St SE
- 6527 Indiana St SE
- 5516 Chelan Ln SE
- 5922 Illinois Ln SE Unit A
- 5231 Mountain Green Ln SE Unit 292
- 5250 College St SE Unit 14
- 5800 SE Titleist Ln
- 5618 Mount Saint Helens St SE
- 5309 Ivy Hill Ln SE
- 5001 College St SE
- 5201 Ivy Hill Ln SE
- 3539 Landview Dr SE
- 3425 Polo Club Ln SE
- 4538 Wiggins Rd SE
- 4712 Kapalea Way SE
- 3725 Wildspitz Ln SE
- 4950 Donovan Dr SE
- 3301 College St SE
- 2928 Ruddell Rd SE
- 2617 Cedar Hills Ct SE
- 1905 Judd St SE
- 4520 Henderson Blvd SE
- 4502 Henderson Blvd SE
- 4530 Briggs Dr
- 4523 Briggs Dr SE
- 4511 Briggs Dr SE
