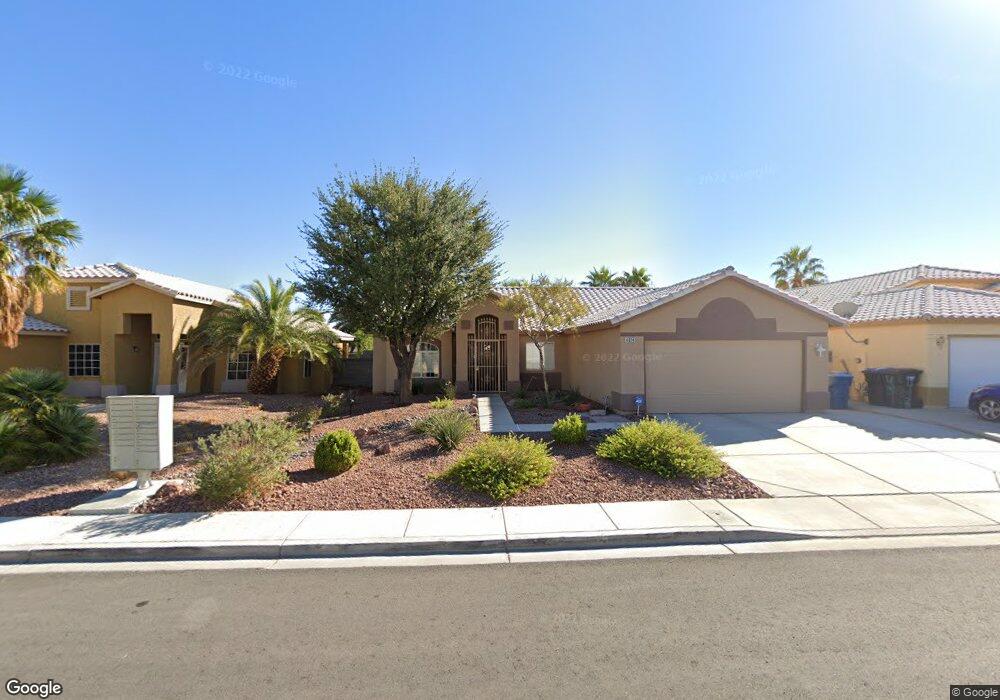
4924 Grimespound Ct Unit 2 North Las Vegas, NV 89031
Craig Ranch NeighborhoodEstimated Value: $413,000 - $442,000
4
Beds
2
Baths
1,804
Sq Ft
$237/Sq Ft
Est. Value
About This Home
This home is located at 4924 Grimespound Ct Unit 2, North Las Vegas, NV 89031 and is currently estimated at $426,647, approximately $236 per square foot. 4924 Grimespound Ct Unit 2 is a home located in Clark County with nearby schools including Addeliar Guy Elementary School, Eva Wolfe Elementary School, and Theron L Swainston Middle School.
Ownership History
Date
Name
Owned For
Owner Type
Purchase Details
Closed on
Jun 15, 2006
Sold by
Isbell Leonora
Bought by
Avella Leonora
Current Estimated Value
Purchase Details
Closed on
Jan 23, 2002
Sold by
Maddox Robert G
Bought by
Maddox Bobbie Lee
Home Financials for this Owner
Home Financials are based on the most recent Mortgage that was taken out on this home.
Original Mortgage
$49,500
Outstanding Balance
$20,415
Interest Rate
7.17%
Estimated Equity
$406,232
Purchase Details
Closed on
Jan 17, 2002
Sold by
Maddox Bobbie Lee
Bought by
Isbell Leonora
Home Financials for this Owner
Home Financials are based on the most recent Mortgage that was taken out on this home.
Original Mortgage
$49,500
Outstanding Balance
$20,415
Interest Rate
7.17%
Estimated Equity
$406,232
Purchase Details
Closed on
Sep 8, 1997
Sold by
Landis Development Ltd Liability Company
Bought by
Maddox Bobbie Lee
Create a Home Valuation Report for This Property
The Home Valuation Report is an in-depth analysis detailing your home's value as well as a comparison with similar homes in the area
Home Values in the Area
Average Home Value in this Area
Purchase History
| Date | Buyer | Sale Price | Title Company |
|---|---|---|---|
| Avella Leonora | -- | None Available | |
| Maddox Bobbie Lee | -- | Fidelity National Title | |
| Isbell Leonora | $137,500 | Fidelity National Title | |
| Maddox Bobbie Lee | $126,500 | Nevada Title Company |
Source: Public Records
Mortgage History
| Date | Status | Borrower | Loan Amount |
|---|---|---|---|
| Open | Isbell Leonora | $49,500 |
Source: Public Records
Tax History Compared to Growth
Tax History
| Year | Tax Paid | Tax Assessment Tax Assessment Total Assessment is a certain percentage of the fair market value that is determined by local assessors to be the total taxable value of land and additions on the property. | Land | Improvement |
|---|---|---|---|---|
| 2025 | $1,436 | $98,336 | $33,600 | $64,736 |
| 2024 | $1,394 | $98,336 | $33,600 | $64,736 |
| 2023 | $1,394 | $92,224 | $30,800 | $61,424 |
| 2022 | $1,354 | $81,802 | $25,550 | $56,252 |
| 2021 | $1,314 | $77,141 | $23,450 | $53,691 |
| 2020 | $1,273 | $74,742 | $21,350 | $53,392 |
| 2019 | $1,236 | $71,247 | $18,550 | $52,697 |
| 2018 | $1,200 | $65,357 | $14,700 | $50,657 |
| 2017 | $2,110 | $62,907 | $11,550 | $51,357 |
| 2016 | $1,137 | $49,802 | $9,100 | $40,702 |
| 2015 | $1,134 | $45,700 | $7,000 | $38,700 |
| 2014 | $1,101 | $38,065 | $5,250 | $32,815 |
Source: Public Records
Map
Nearby Homes
- 4876 Lucas Creek Ct
- Denali Next Gen w/RV Plan at The Montgomery
- Leighton Next Gen w/RV Plan at The Montgomery
- Ganon Next Gen w/RV Plan at The Montgomery
- 5139 Keswick Rd
- 4890 Willis St
- 3800 Liberator Way
- 5222 Nest Ct
- 2918 Woodbourne Ave
- 4636 Ferrell St
- 5030 Amber Crossing St
- 3012 Silver Canyon Ln
- 4623 Reliant St
- 4006 Clove Tree Ct
- 3519 W Red Coach Ave
- 4001 Clove Tree Ct
- 4618 Zia Ridge St
- 3021 Robincrest Ct
- 2810 Water Sport Ave
- 3804 Dauntless Dr
- 4928 Grimespound Ct
- 4920 Grimespound Ct Unit N
- 4920 Grimespound Ct Unit None
- 4920 Grimespound Ct
- 4923 Dunvegan Ct
- 4919 Dunvegan Ct
- 4927 Dunvegan Ct
- 4916 Grimespound Ct
- 4932 Grimespound Ct
- 4923 Grimespound Ct Unit 2
- 4915 Dunvegan Ct
- 4931 Dunvegan Ct
- 4927 Grimespound Ct
- 4919 Grimespound Ct
- 4912 Grimespound Ct
- 4915 Grimespound Ct
- 4931 Grimespound Ct
- 4911 Dunvegan Ct
- 4911 Grimespound Ct
- 4924 Dunvegan Ct