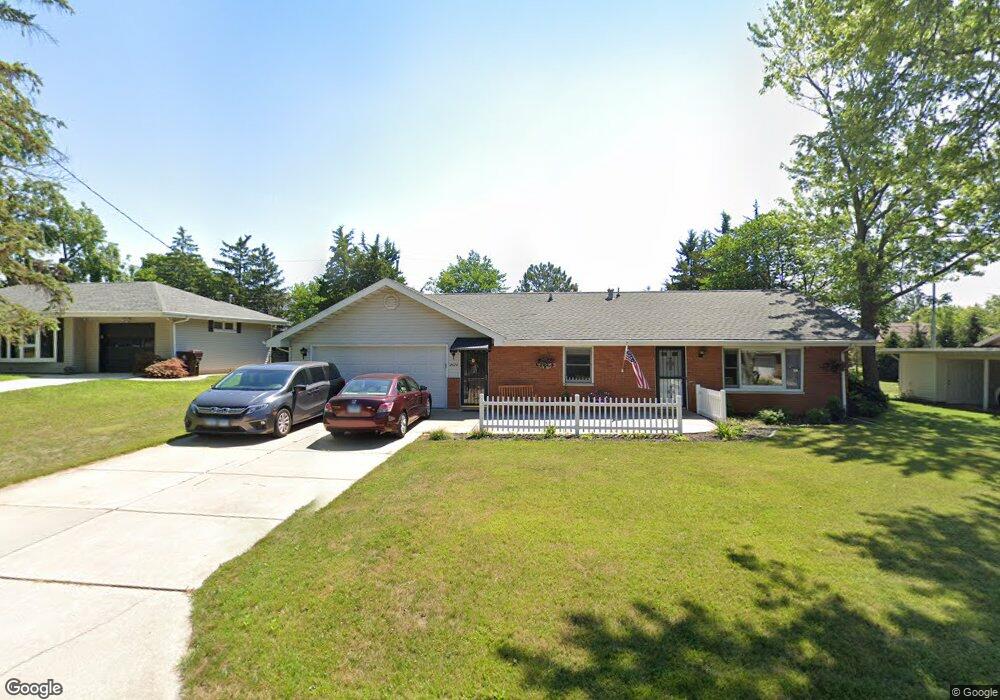
4924 N Graceland Dr Unit 3 Peoria, IL 61614
North Peoria Neighborhood
2
Beds
2
Baths
1,650
Sq Ft
--
Built
About This Home
This home is located at 4924 N Graceland Dr Unit 3, Peoria, IL 61614. 4924 N Graceland Dr Unit 3 is a home located in Peoria County with nearby schools including Northmoor Primary School, Rolling Acres Middle School, and Richwoods High School.
Ownership History
Date
Name
Owned For
Owner Type
Purchase Details
Closed on
Dec 3, 2024
Sold by
Jackson Candice
Bought by
Margetis Pete
Purchase Details
Closed on
Aug 22, 2023
Sold by
Sommars Mark and Sommars Susan
Bought by
Jackson Candice
Home Financials for this Owner
Home Financials are based on the most recent Mortgage that was taken out on this home.
Original Mortgage
$150,350
Interest Rate
6.81%
Mortgage Type
New Conventional
Purchase Details
Closed on
May 23, 2018
Sold by
Haste Terry R
Bought by
Sommars Mark
Home Financials for this Owner
Home Financials are based on the most recent Mortgage that was taken out on this home.
Original Mortgage
$85,600
Interest Rate
4.4%
Mortgage Type
New Conventional
Purchase Details
Closed on
Jul 9, 2004
Bought by
Maushard Thomas and Maushard Nancy
Create a Home Valuation Report for This Property
The Home Valuation Report is an in-depth analysis detailing your home's value as well as a comparison with similar homes in the area
Home Values in the Area
Average Home Value in this Area
Purchase History
| Date | Buyer | Sale Price | Title Company |
|---|---|---|---|
| Margetis Pete | $165,000 | None Listed On Document | |
| Jackson Candice | $155,000 | None Listed On Document | |
| Sommars Mark | $107,000 | Attorney Only | |
| Sommars Mark | $107,000 | Cusack Gilfillan O Day Llc | |
| Maushard Thomas | $125,900 | -- |
Source: Public Records
Mortgage History
| Date | Status | Borrower | Loan Amount |
|---|---|---|---|
| Previous Owner | Jackson Candice | $150,350 | |
| Previous Owner | Jackson Candice | $6,000 | |
| Previous Owner | Sommars Mark | $85,600 |
Source: Public Records
Tax History Compared to Growth
Tax History
| Year | Tax Paid | Tax Assessment Tax Assessment Total Assessment is a certain percentage of the fair market value that is determined by local assessors to be the total taxable value of land and additions on the property. | Land | Improvement |
|---|---|---|---|---|
| 2024 | $3,984 | $50,050 | $8,480 | $41,570 |
| 2023 | $3,286 | $45,920 | $7,780 | $38,140 |
| 2022 | $2,847 | $40,510 | $7,220 | $33,290 |
| 2021 | $2,742 | $38,580 | $6,880 | $31,700 |
| 2020 | $2,726 | $38,200 | $6,810 | $31,390 |
| 2019 | $2,787 | $38,980 | $6,950 | $32,030 |
| 2018 | $0 | $39,360 | $7,020 | $32,340 |
| 2017 | $3,705 | $39,760 | $7,090 | $32,670 |
| 2016 | $3,705 | $39,760 | $7,090 | $32,670 |
| 2015 | $2,665 | $38,980 | $6,950 | $32,030 |
| 2014 | $2,633 | $40,660 | $6,600 | $34,060 |
| 2013 | $2,632 | $41,150 | $6,680 | $34,470 |
Source: Public Records
Map
Nearby Homes
- 1910 W Sunnyview Dr
- 1412 W Glen Ave
- 4808 N Glen Ct
- 5213 N Merrimac Ave
- 5108 N Woodview Ave
- 5317 N Woodview Ave
- 5003 N Mansfield Dr
- 1914 W White Oak Dr
- 5506 N Longwood Dr
- 5501 N Holly Hedges Ct
- 1518 W Devereux Dr
- 5710 N Western Ave
- 5607 N Plaza Dr
- 1012 W Shenandoah Dr
- 5225 N Hamilton Rd
- 2135 W Orlando Dr
- 5302 N Arrow Dr
- 5419 N Renwood Ave
- 4212 N Keenland Ave
- 2505 W Camille St
- 4928 N Graceland Dr
- 4918 N Graceland Dr
- 5004 N Graceland Dr
- 4923 N Graceland Dr
- 4929 N Graceland Dr
- 4917 N Graceland Dr
- 1717 W Glen Ave
- 1805 W Glen Ave
- 5012 N Graceland Dr
- 5005 N Graceland Dr
- 4927 N Glen Park Place
- 4921-4927 N Glen Park Place
- 4921 N Glen Park Place
- 5011 N Graceland Dr
- 5016 N Graceland Dr
- 1814 W Broughton Ct
- 5015 N Graceland Dr
- 1817 W Glen Ave
- 1816 W Broughton Ct
- 4819 N Nelson Dr