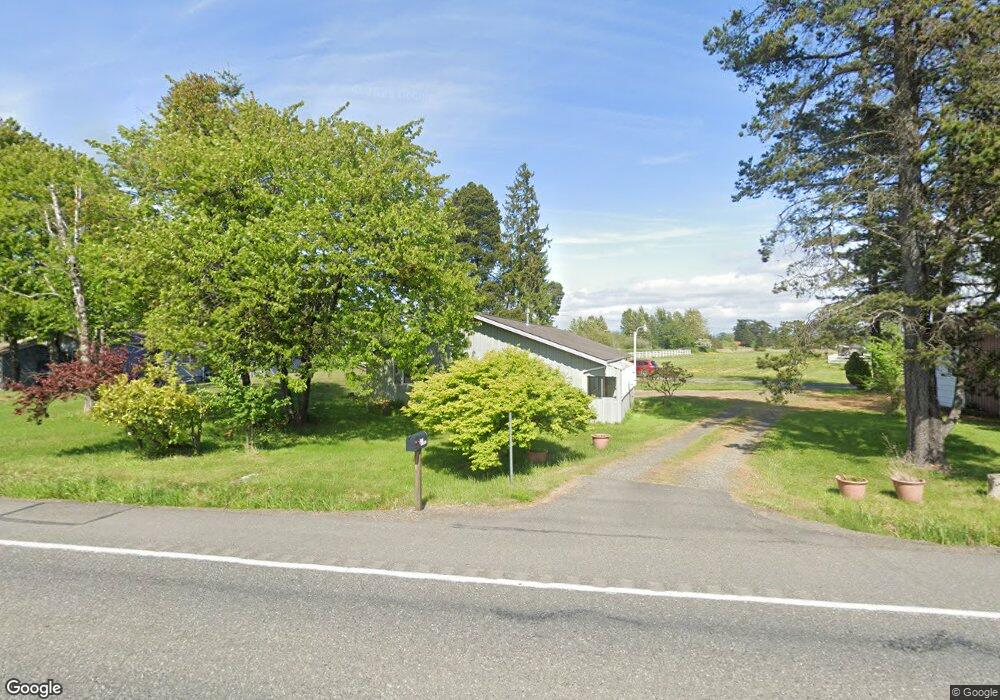
4924 Northwest Dr Bellingham, WA 98226
Estimated Value: $576,000 - $721,000
5
Beds
3
Baths
3,124
Sq Ft
$216/Sq Ft
Est. Value
About This Home
This home is located at 4924 Northwest Dr, Bellingham, WA 98226 and is currently estimated at $673,376, approximately $215 per square foot. 4924 Northwest Dr is a home located in Whatcom County with nearby schools including Central Elementary School, Vista Middle School, and Ferndale High School.
Ownership History
Date
Name
Owned For
Owner Type
Purchase Details
Closed on
May 13, 2003
Sold by
Vanwerven Nancy
Bought by
Vanwerven Gary
Current Estimated Value
Home Financials for this Owner
Home Financials are based on the most recent Mortgage that was taken out on this home.
Original Mortgage
$140,000
Outstanding Balance
$60,492
Interest Rate
5.71%
Mortgage Type
Purchase Money Mortgage
Estimated Equity
$612,884
Purchase Details
Closed on
May 12, 2003
Sold by
Liffengren Robert D and Liffengren Lucinda L
Bought by
Vanwerven Gary and Vanwerven Nancy
Home Financials for this Owner
Home Financials are based on the most recent Mortgage that was taken out on this home.
Original Mortgage
$140,000
Outstanding Balance
$60,492
Interest Rate
5.71%
Mortgage Type
Purchase Money Mortgage
Estimated Equity
$612,884
Purchase Details
Closed on
Apr 28, 2000
Sold by
Liffeugren Robert D
Bought by
Liffeugren Robert D and Liffeugren Lucinda L
Create a Home Valuation Report for This Property
The Home Valuation Report is an in-depth analysis detailing your home's value as well as a comparison with similar homes in the area
Home Values in the Area
Average Home Value in this Area
Purchase History
| Date | Buyer | Sale Price | Title Company |
|---|---|---|---|
| Vanwerven Gary | -- | Whatcom Land Title | |
| Vanwerven Gary | $167,612 | Whatcom Land Title | |
| Liffeugren Robert D | -- | -- |
Source: Public Records
Mortgage History
| Date | Status | Borrower | Loan Amount |
|---|---|---|---|
| Open | Vanwerven Gary | $140,000 |
Source: Public Records
Tax History Compared to Growth
Tax History
| Year | Tax Paid | Tax Assessment Tax Assessment Total Assessment is a certain percentage of the fair market value that is determined by local assessors to be the total taxable value of land and additions on the property. | Land | Improvement |
|---|---|---|---|---|
| 2024 | $4,880 | $662,860 | $264,810 | $398,050 |
| 2023 | $4,880 | $682,741 | $300,000 | $382,741 |
| 2022 | $4,635 | $603,472 | $224,712 | $378,760 |
| 2021 | $4,673 | $498,736 | $185,712 | $313,024 |
| 2020 | $4,501 | $461,804 | $171,960 | $289,844 |
| 2019 | $3,597 | $402,218 | $149,772 | $252,446 |
| 2018 | $4,117 | $367,735 | $136,932 | $230,803 |
| 2017 | $3,590 | $322,264 | $120,000 | $202,264 |
| 2016 | $3,385 | $301,649 | $110,240 | $191,409 |
| 2015 | $3,407 | $284,003 | $104,370 | $179,633 |
| 2014 | -- | $278,114 | $102,000 | $176,114 |
| 2013 | -- | $274,198 | $100,000 | $174,198 |
Source: Public Records
Map
Nearby Homes
- 4958 Pacific Hwy
- 4754 Aldrich Rd
- 794 W Smith Rd
- 703 Northview St
- 700 Northview St
- 555 (Lot 18) Northview St
- 552 (Lot 5) Northview St
- 546 (Lot 7) Northview St
- 544 (Lot 8) Northview St
- 553 (Lot 19) Northview St
- 662 (Lot 26) W Kline Rd
- 1474 Sunset Ave
- 652 (Lot 30) W Kline Rd
- 5502 Northwest Dr
- 514 Northview St
- 5094 Labounty Rd
- 4623 Quinn Ct Unit I101
- 4621 Quinn Ct
- 4558 Wynn Rd
- 1416 Marietta Ave
- 0 11xx Sunset Ave
- 4938 Northwest Dr
- 4922 Waschke Rd
- 4948 Northwest Dr
- 4933 Northwest Dr
- 4956 Waschke Rd
- 4967 Waschke Rd
- 4954 Northwest Dr
- 4902 Northwest Dr
- 4960 Northwest Dr
- 4901 Northwest Dr
- 4897 Northwest Dr
- 4975 Waschke Rd
- 4890 Northwest Dr
- 4976 Waschke Rd
- 4972 Northwest Dr
- 4878 Northwest Dr
- 5007 Waschke Rd
- 853 Lange Rd
- 4996 Northwest Dr